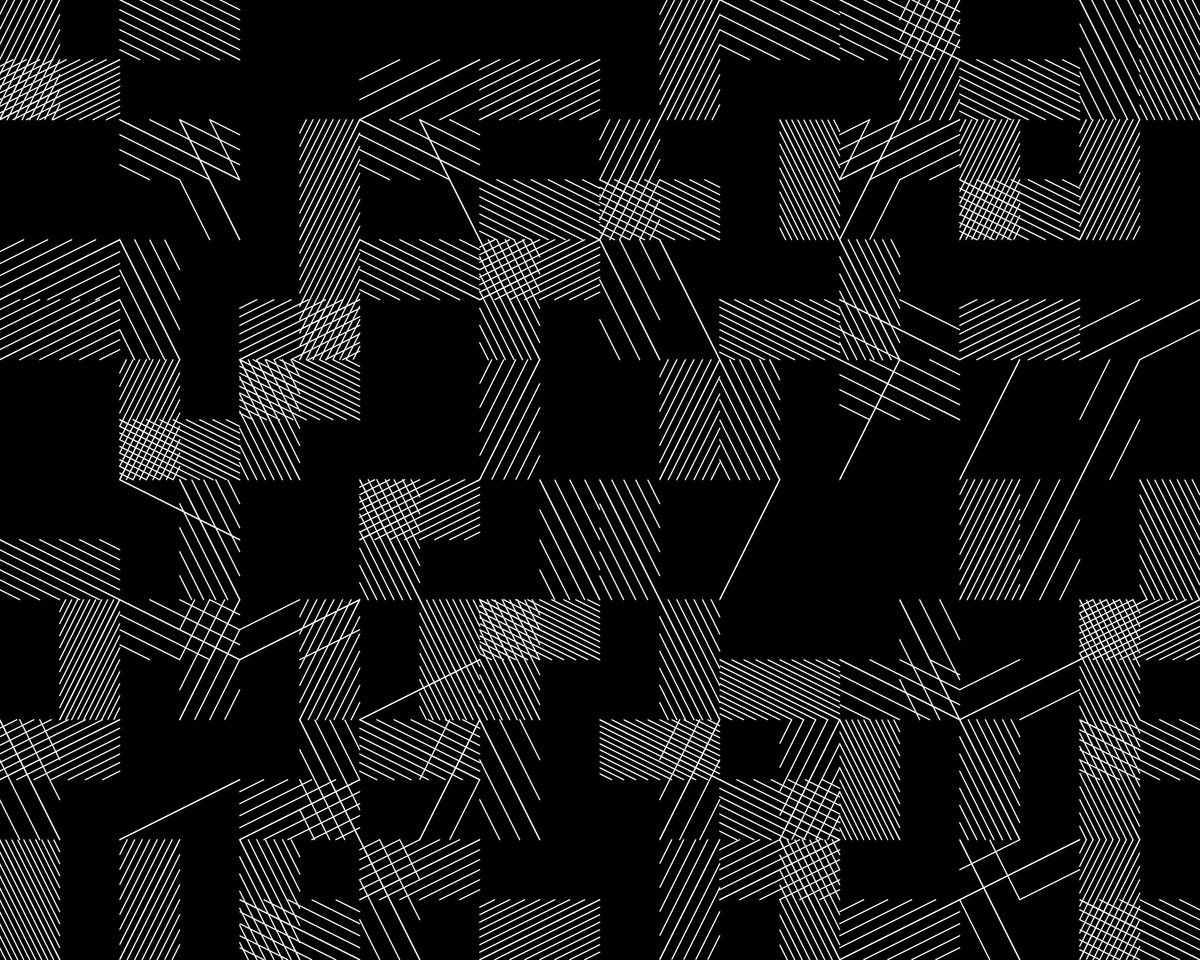
In this recode tutorial we'll recreate Vera Molnar's piece "À la recherche de Paul Klee" from 1970. For these recodes, there's no exact recount of how the original code was implemented, we can only rely on observation of the piece to deduce what could have been.
Looking for Paul Klee
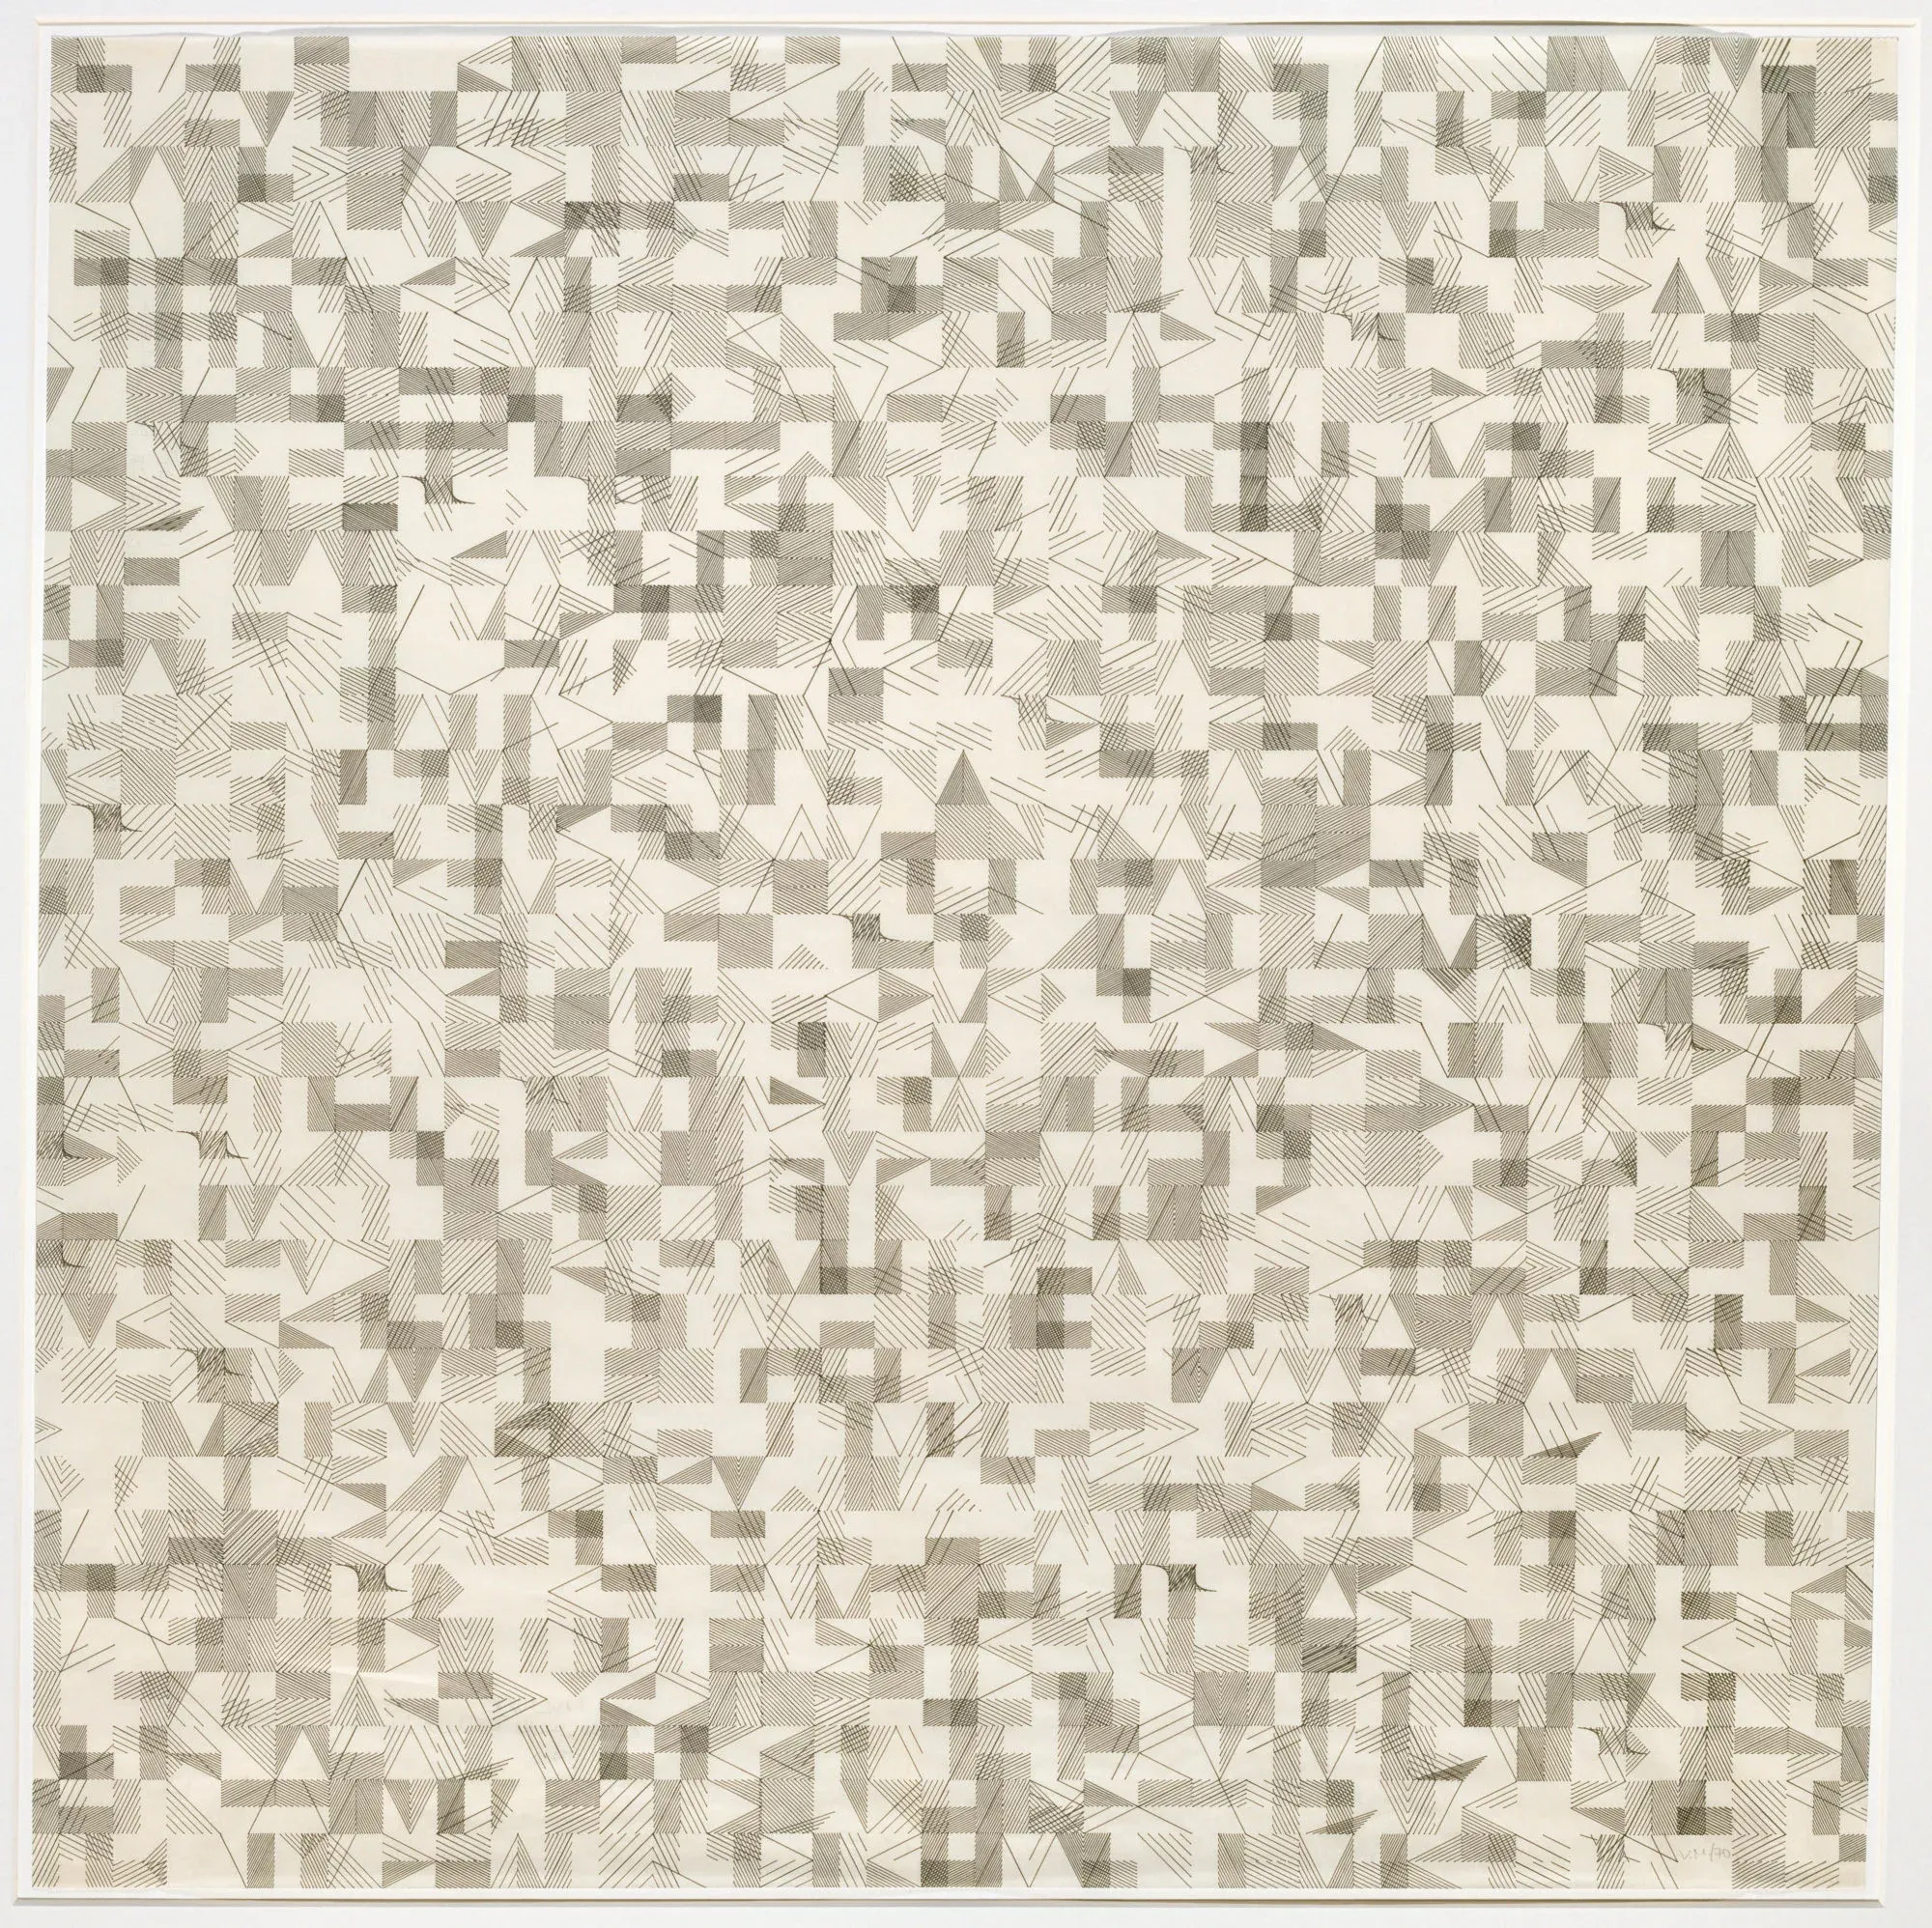
While diving into Vera Molnar's life as one the pioneers of generative art, one of her artworks that struck me as particularly interesting was her homage to Paul Klee from 1970, titled À la recherche de Paul Klee. After recreating Frieder Nake's homage to Paul Klee last year, it only made sense to also have a go at this one.
A little #RecodeRethink étude! Homage to Frieder Nake's 'Homage to Paul Klee'!
— Ahmad Moussa || Gorilla Sun (@gorillasu) November 9, 2022
I think I got pretty close 🤔 #creativecoding #p5js
Original on the left 👈 and recreation on the right 👉 pic.twitter.com/l6gA4YfEJ7
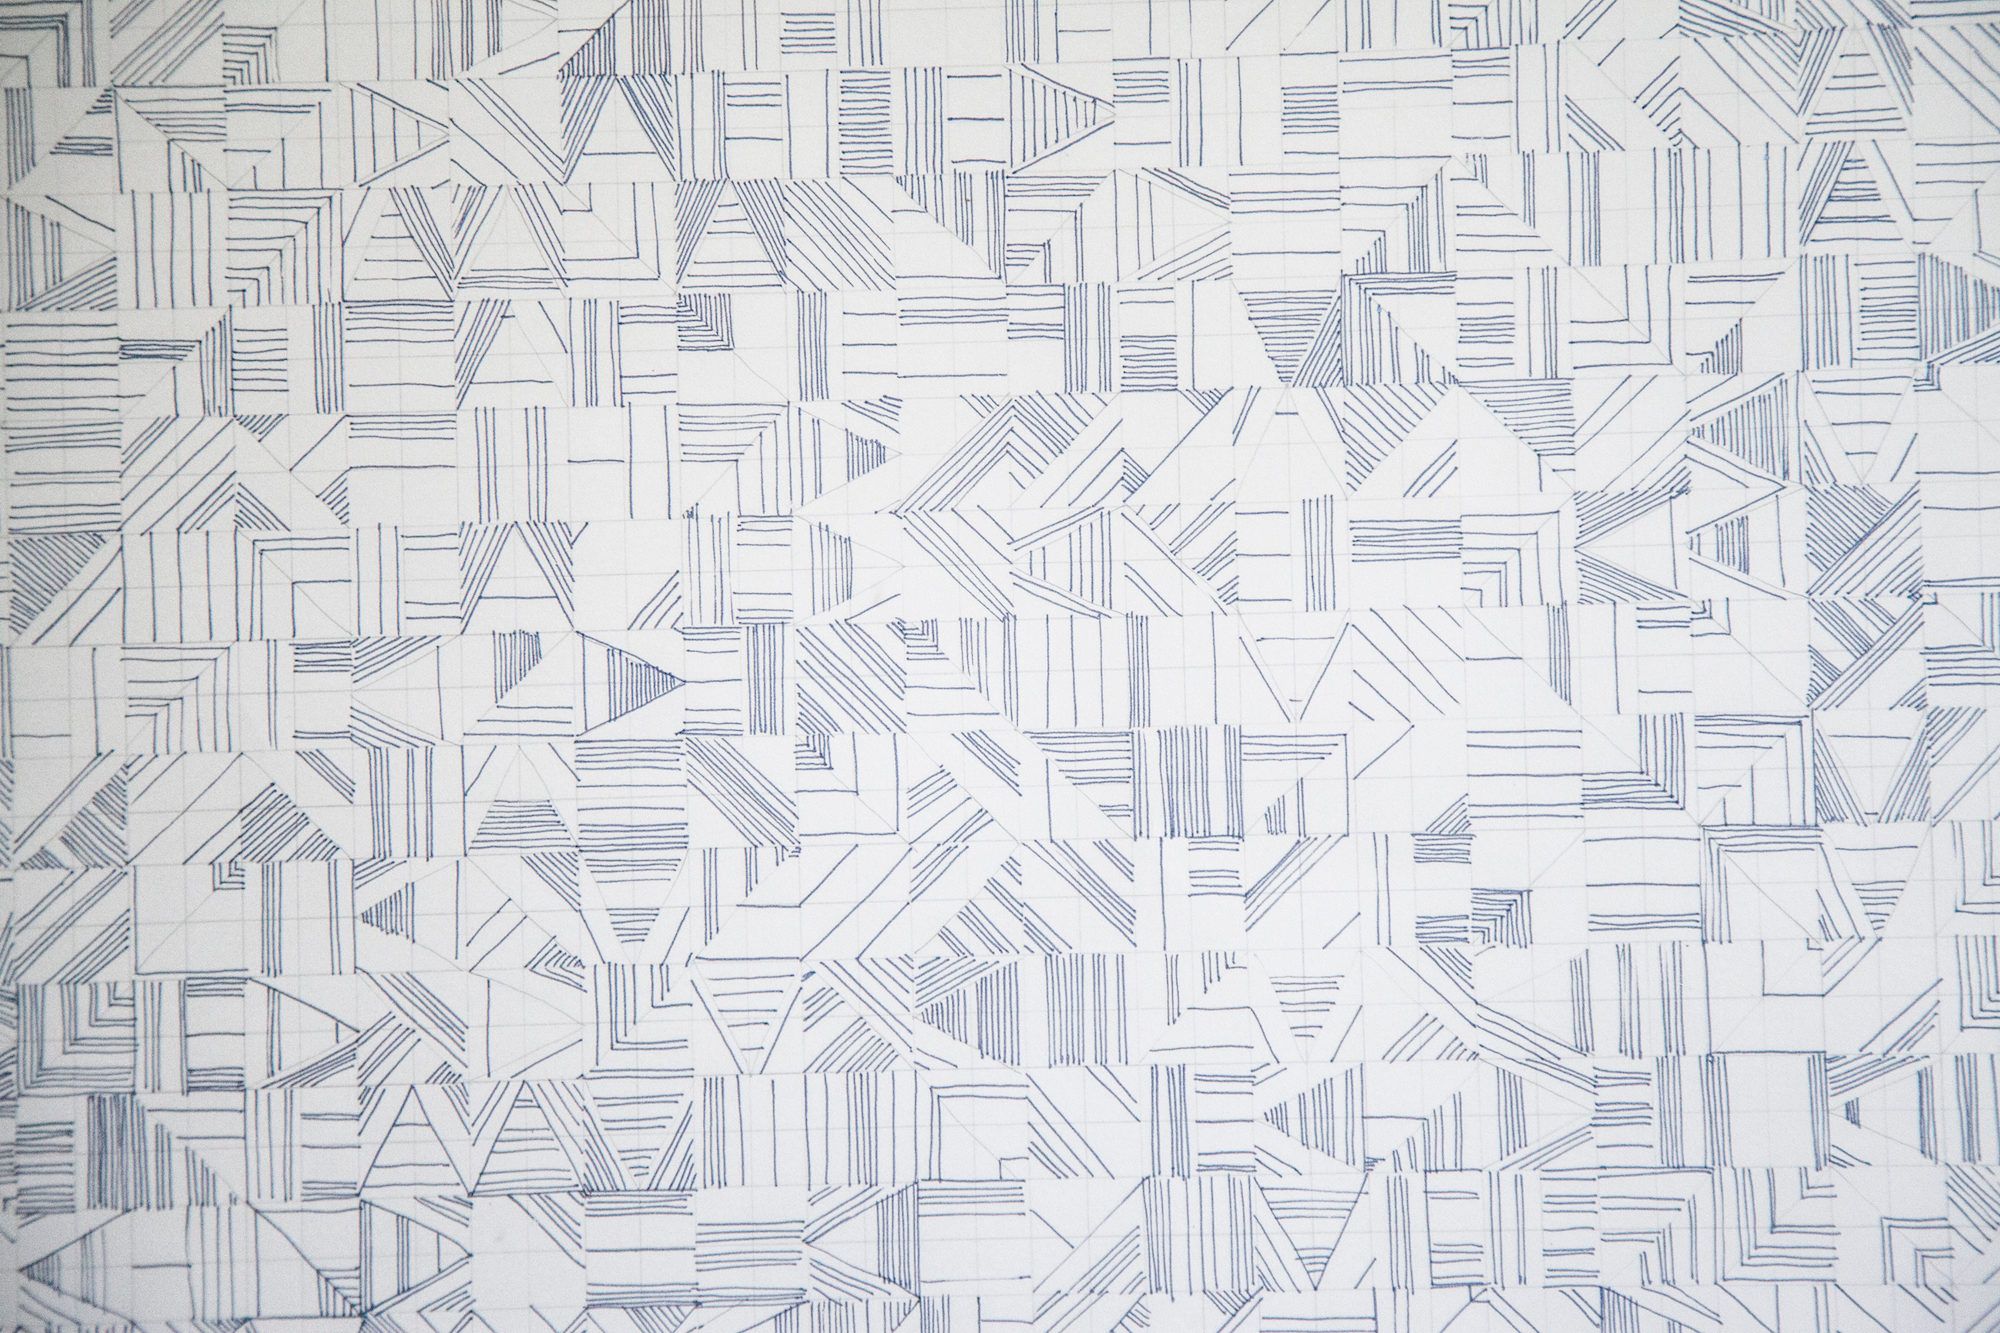
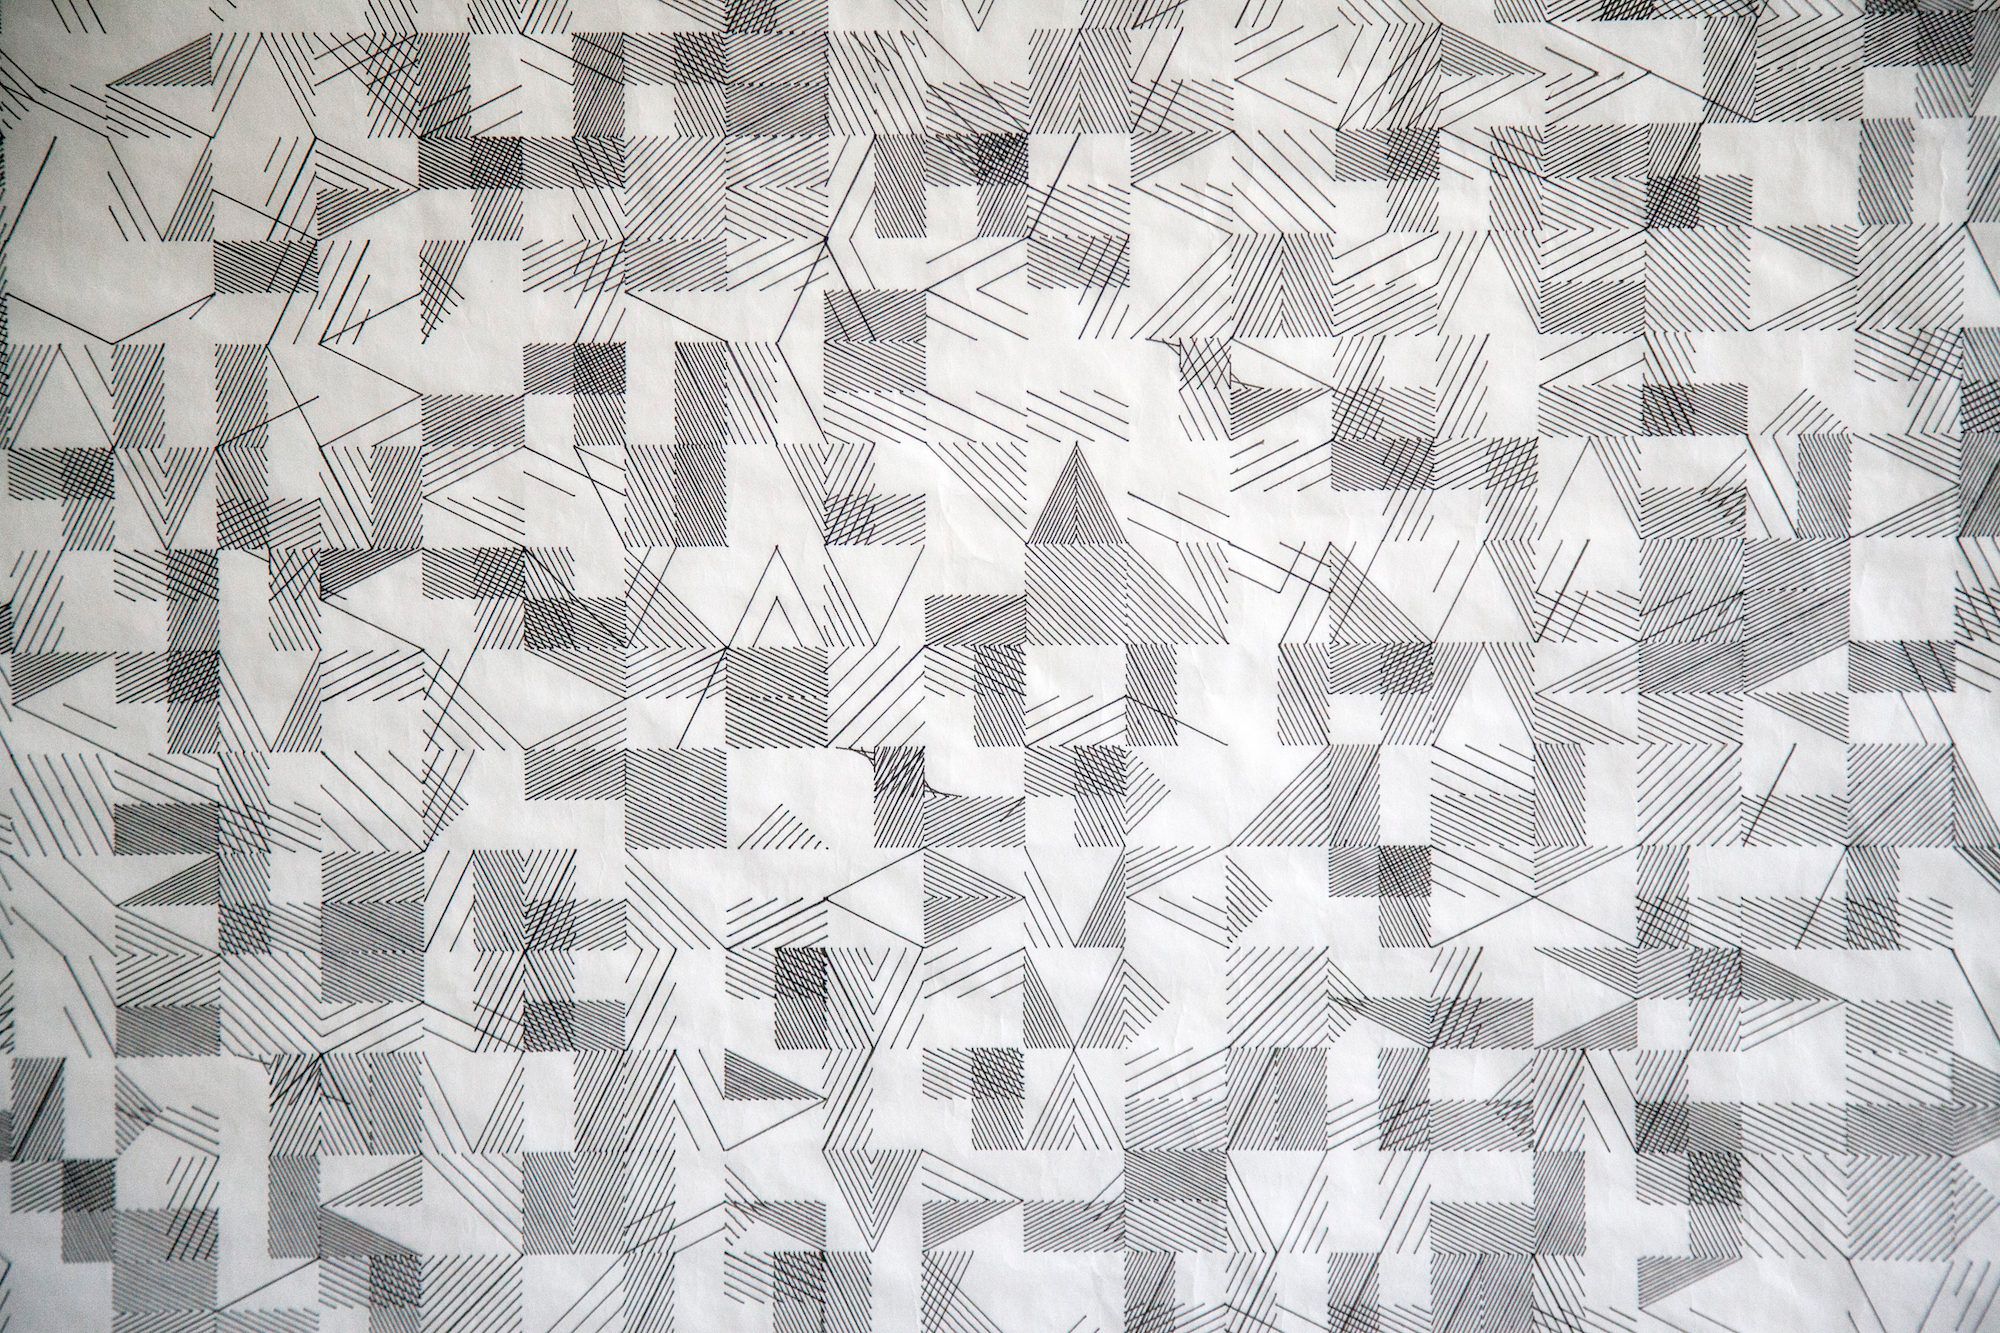
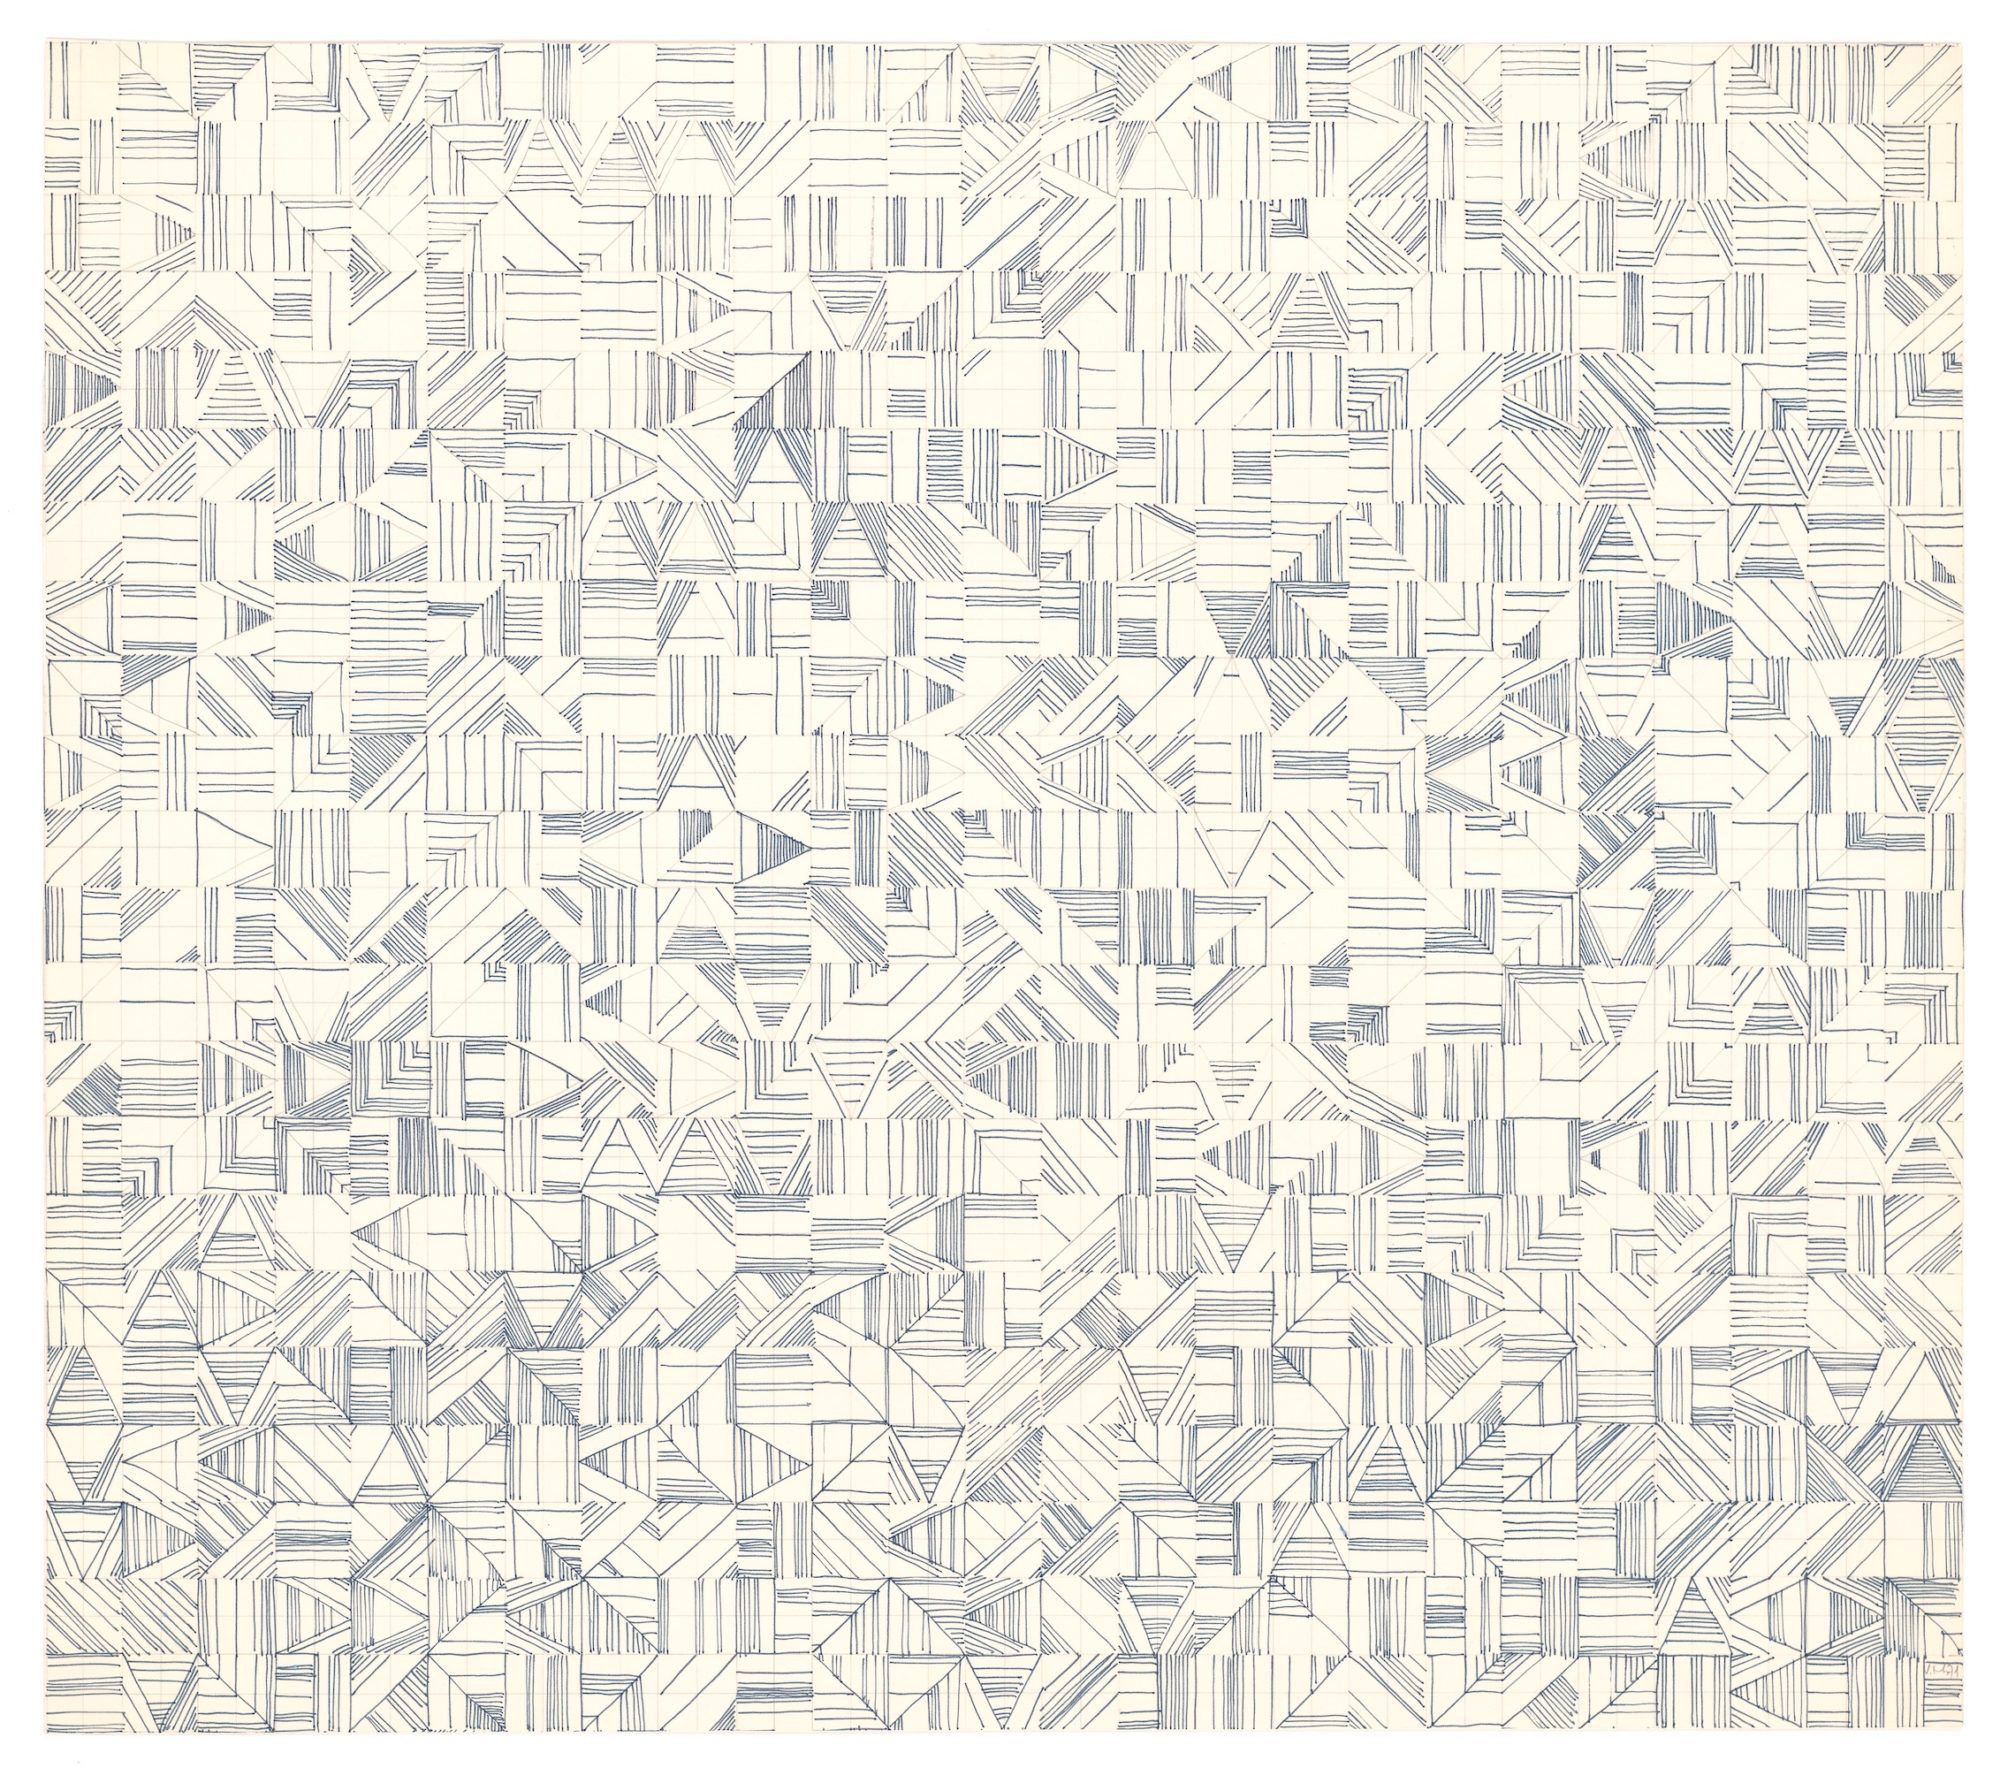
What's intriguing about this piece is that Vera did several versions of it. An initial analogue, hand-drawn one, following her machine imaginaire methodology, and another digital version later on, using computers at the beginning of the 1970s. Each one of them is charming in it's own way.
There also exists a color version, but I'm not certain if it was created during the same period of time or later on:
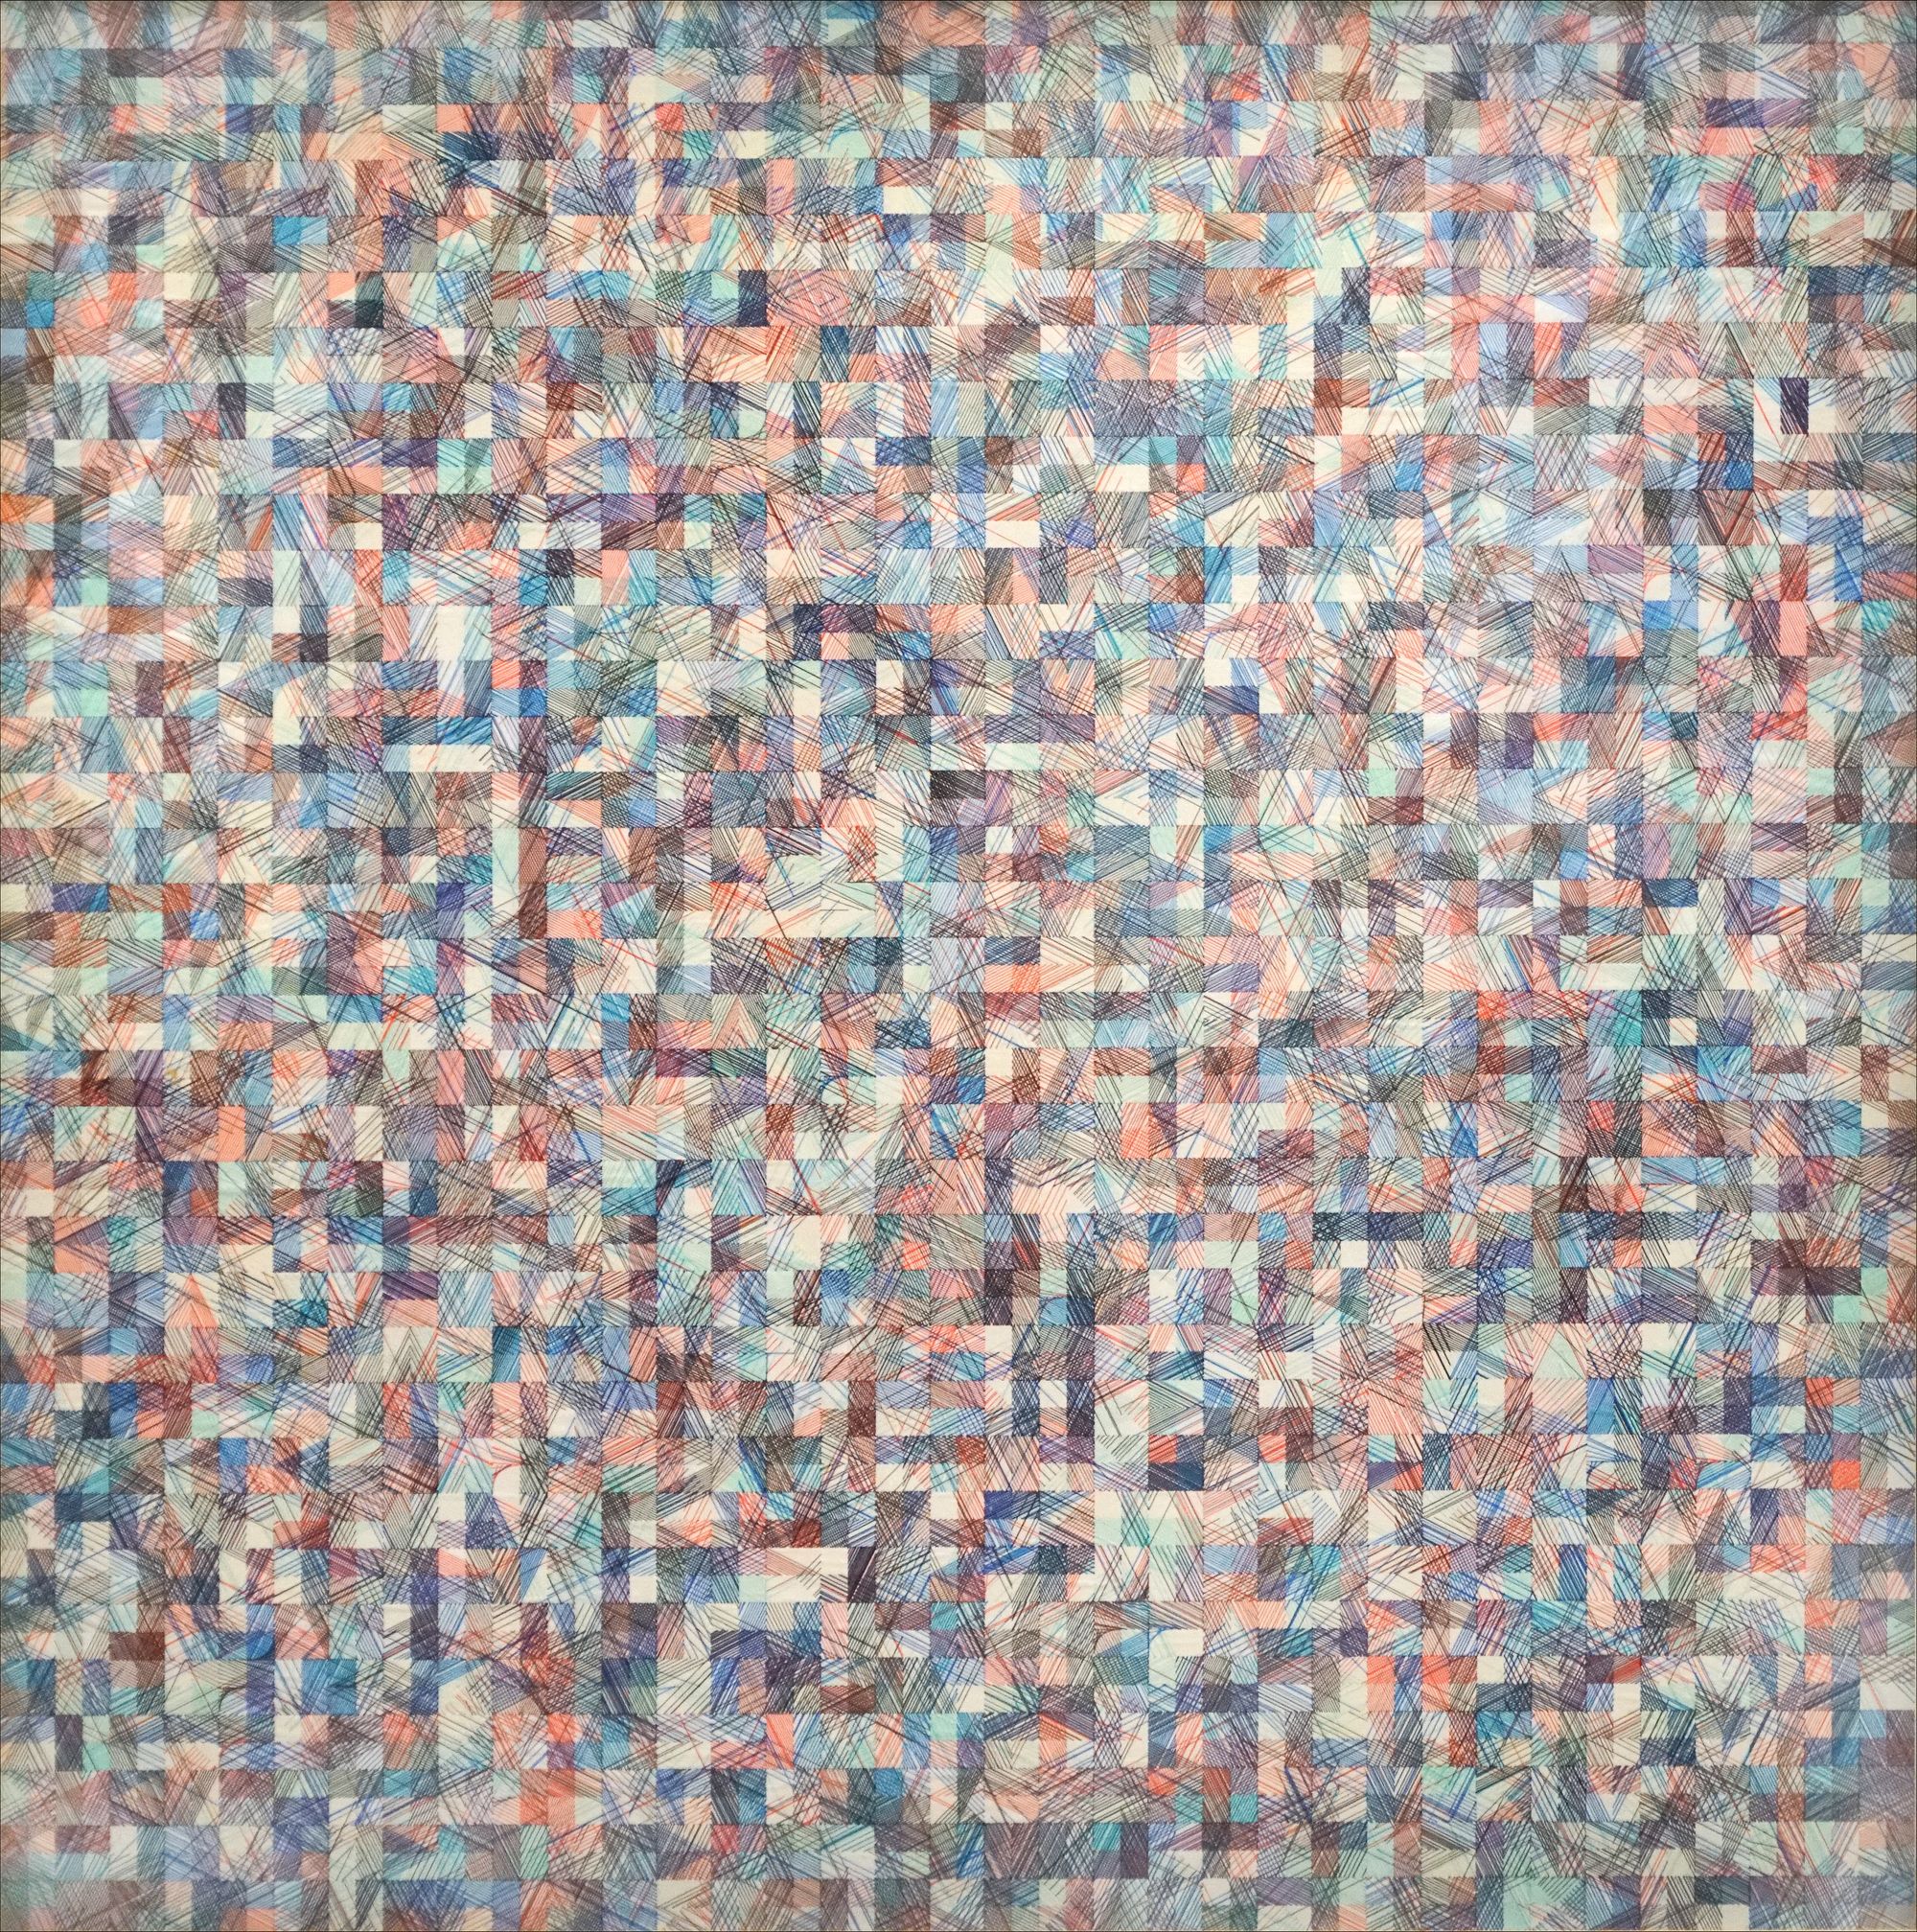
It is incredibly vexing that there isn't much information about each one of these artworks, and in what order they were made.
Hachures and line patterns are still a very prominent thematic in generative art today:
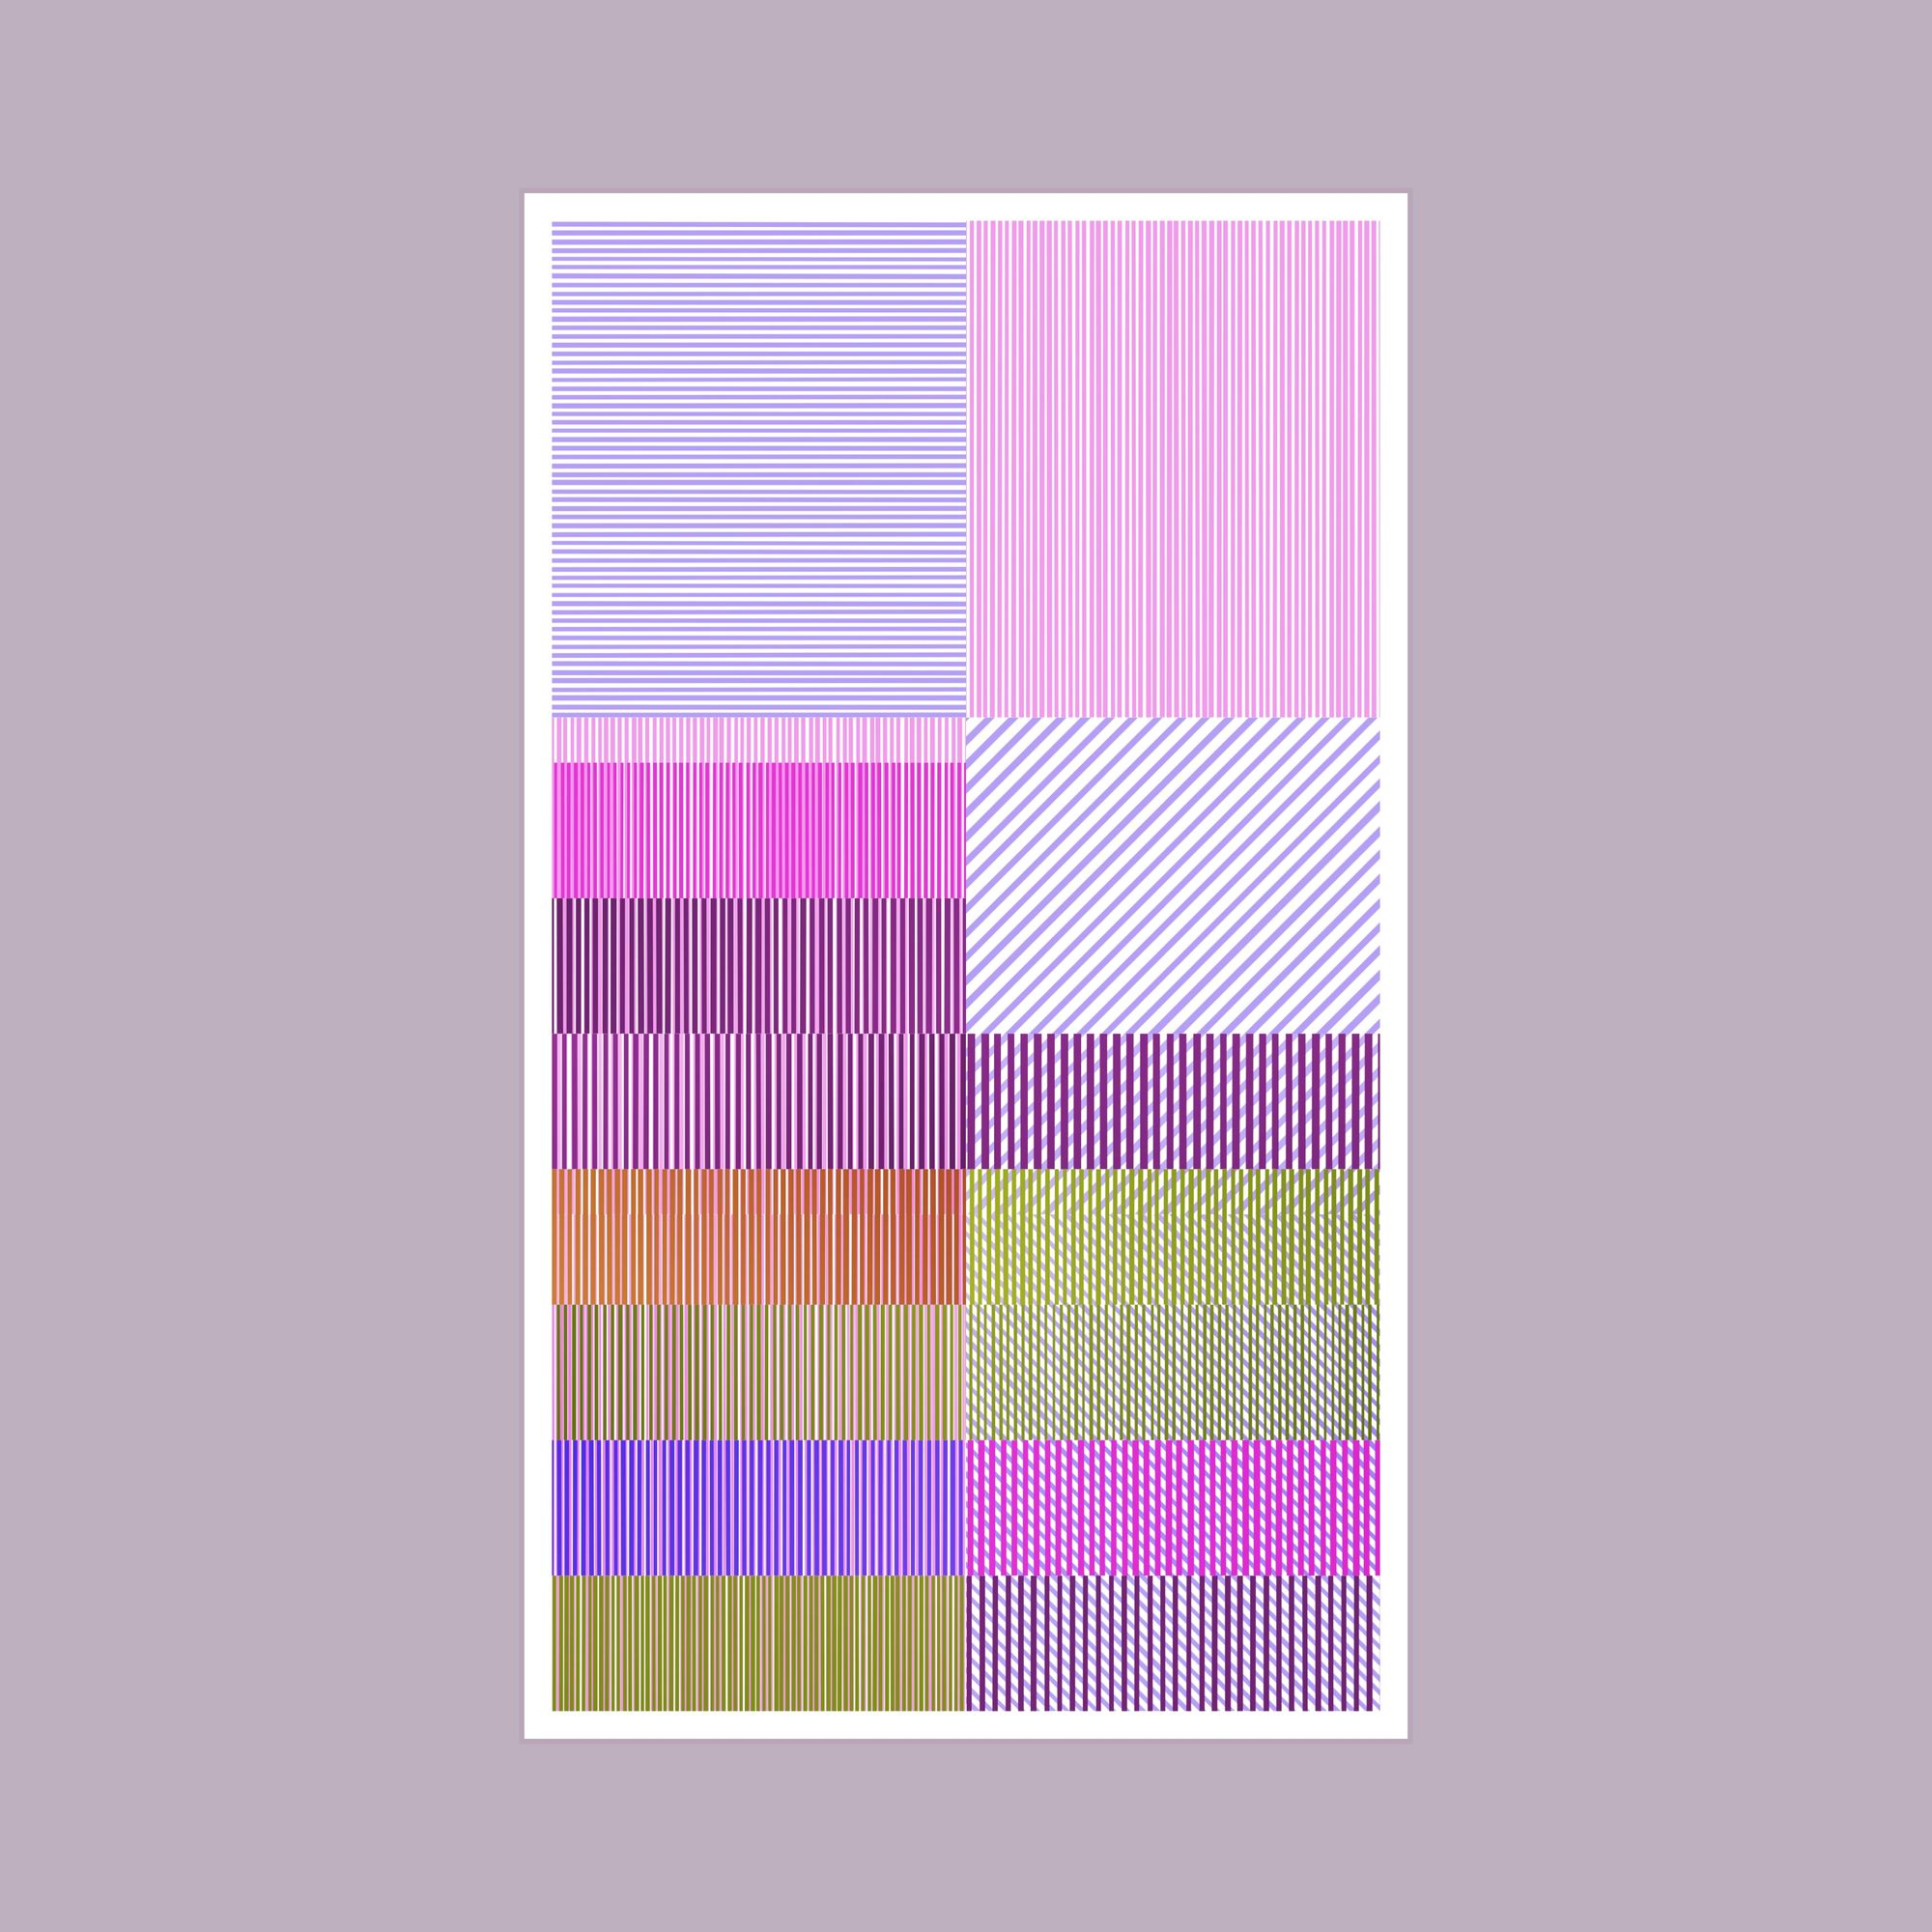
Maybe it's due to the fact that lines are one of the basic shapes, that every graphics drawing library is capable of producing. But that also makes me wonder if generative art today would be different today if it hadn't been for these pioneering ideas in the 60s.
Canvas and the Grid
As always, let's first set up the canvas in our p5 project:
const WID = 1000;
const HEI = 1000;

const PAD = 100;

let buff;
function setup(){
  createCanvas(WID, HEI)
  buff = createGraphics(WID, HEI)

  // the rendering context, we'll need it in just a bit
  bctx = buff.canvas.getContext('2d')

  buff.background(255)
  buff.stroke(0)
}
Here we're using a graphics buffer, this makes things a little bit more organized.
As for the grid, my favorite method for creating them, is one where the loops are dimension agnostic. This means that we declare the number of horizontal and vertical grid cells as hyper-parameters, then compute the width and height of the grid cells based off of the overall width and height of the canvas (plus/minus padding if any).
The nested loop itself has nothing to do with the dimension of the grid or the canvas, and simply iterates over the number of rows and columns. Positioning of the cells becomes a separate calculation:
// Number of horizontal and vertical grid cells
const GRID_X = 10
const GRID_Y = 10

// Since the number of cells match up with the dimensions of the canvas
// We get cells that have equal width and height
const GRID_X_SPC = (WID-PAD*2)/GRID_X
const GRID_Y_SPC = (HEI-PAD*2)/GRID_Y

function drawGrid(b){

  b.push()

  // The loops have no information about the size of the cells
  // Simply how many cells there are
  for(let x = 0; x < GRID_X; x++){
    for(let y = 0; y < GRID_Y; y++){

      b.push()

      // The correct position of the cells can be computed as follows
      b.translate(
        x * GRID_X_SPC + PAD,
        y * GRID_Y_SPC + PAD
      )

      /* code that draws the patch goes here */

      b.pop()
    }
  }
}
Here we use p5's translate function to position the individual grid cells, as it'll make dealing with coordinates a little easier down the line.
Golan Levin's Molnar Patches
While researching this particular, piece I came across a recode by Golan Levin. If you don't know Golan, you gotta check out the OG. He has a really interesting strategy to recreate the artwork, which we'll examine in more detail over the next sections.
Golan's method essentially splits the rectangular patches into two right angled triangles, and draws diagonal lines inside of these triangles. These diagonals connect the two sides that sit at the base of the right angle, and are parallel to the hypotenuse. To achieve this, he utilizes the map() function that already comes out of the box with p5js.
His magical function:
function molnarRect(b, x, y, w, h) {
  var x1 = x;
  var x2 = x + w;

  var nDiagonals = round(10 * pow(random(0, 1), 0.85));

  for (var i = 1; i <= nDiagonals; i++) {
    var px = map(i, 0, nDiagonals, x1, x2);
    var py = y + h;
    var qx = x1;
    var qy = map(i, 0, nDiagonals, y + h, y);
    b.line(px, py, qx, qy);
  }

  for (var i = 1; i <= nDiagonals; i++) {
    var px = map(i, 0, nDiagonals, x2, x1);
    var py = y;
    var qx = x2;
    var qy = map(i, 0, nDiagonals, y, y + h);
    b.line(px, py, qx, qy);
  }
}The first magic line in here, is the one that determines the number of lines to be drawn. Before multiplying and rounding the randomly generated number, he raises this random number by a specific coefficient. He probably found that a value of .85 hits the sweet spot and produces balanced patterns that come close to Vera Molnar's original artwork.
var nDiagonals = round(10 * pow(random(0, 1), 0.85));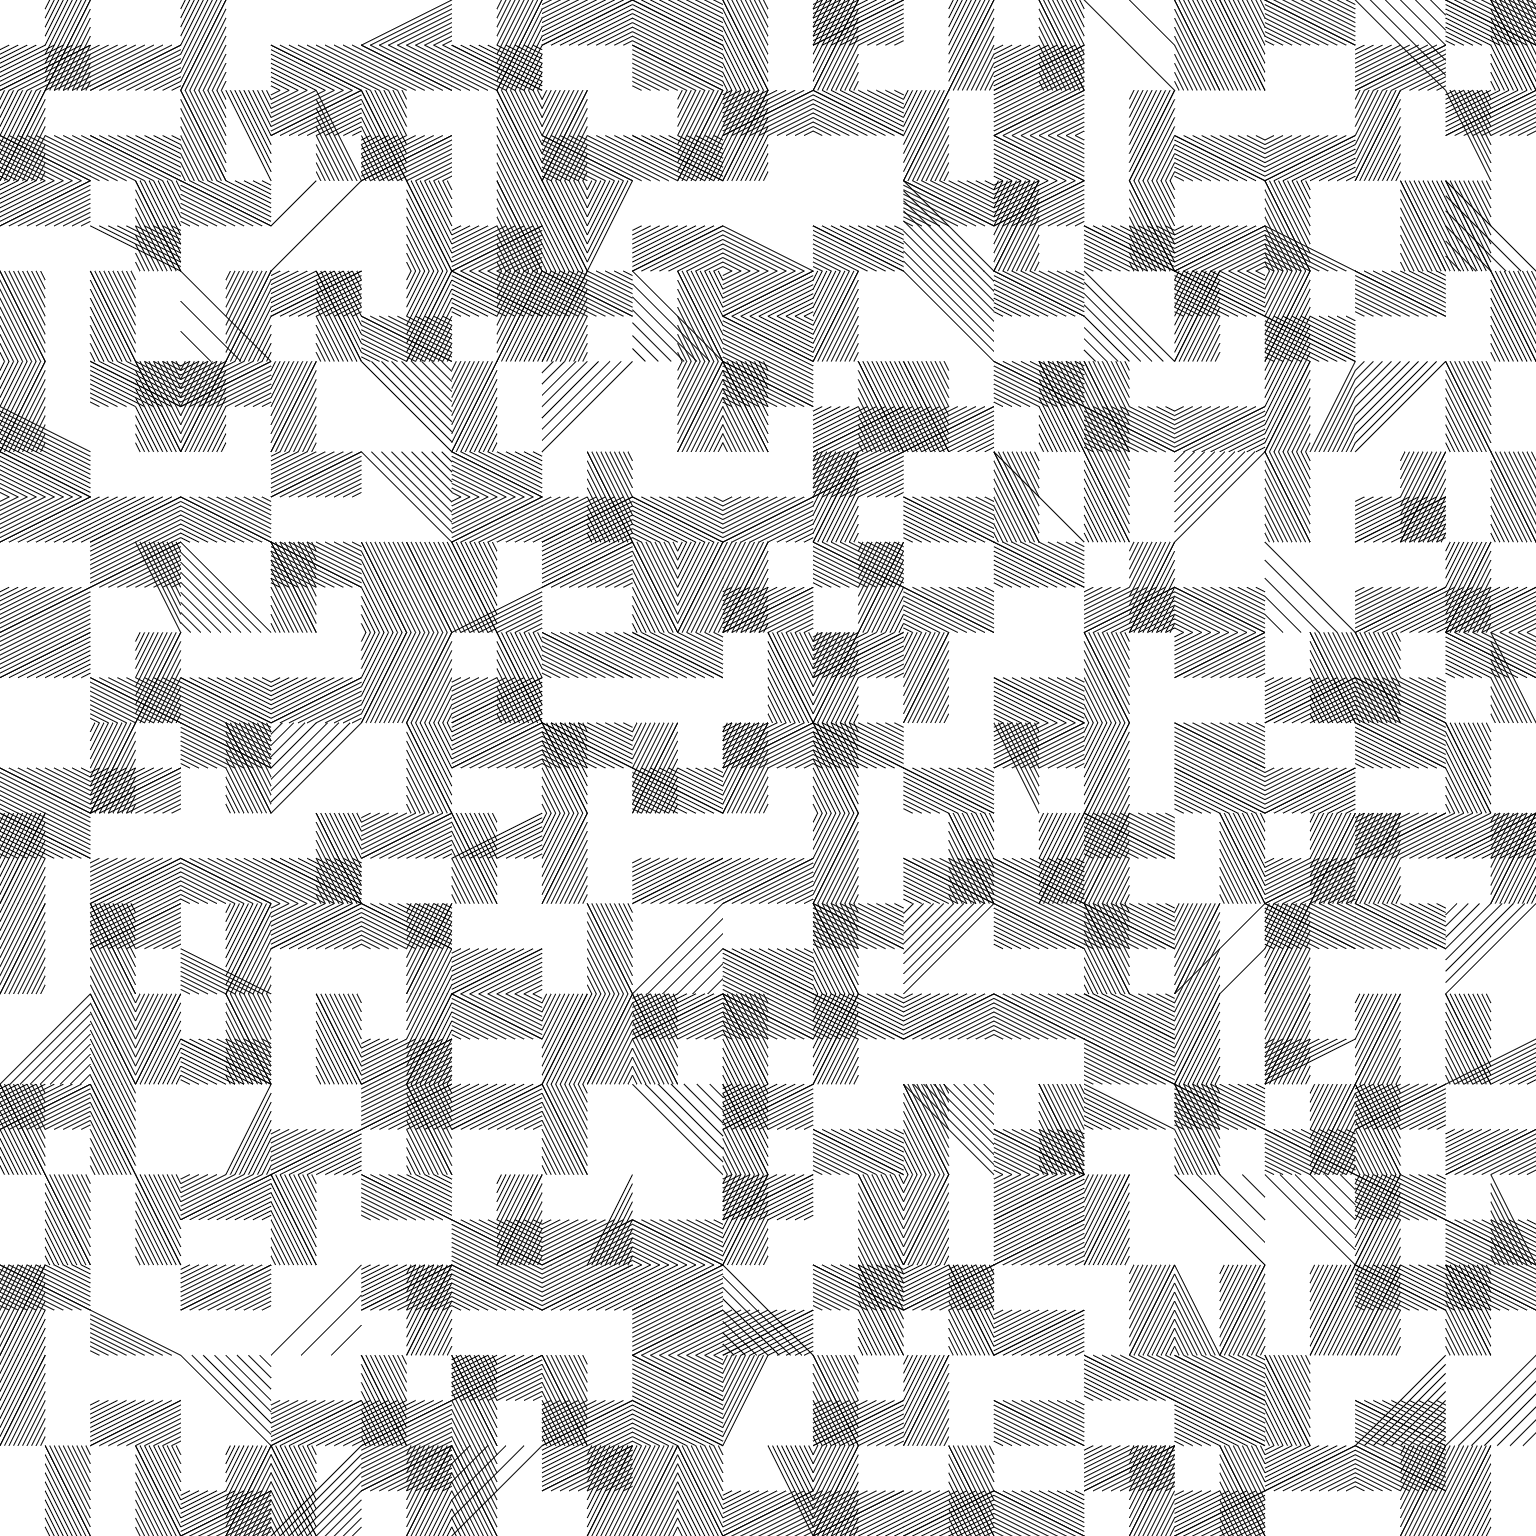
This number is then used inside the loop condition to determine how many lines need to be drawn:
for (var i = 1; i <= nDiagonals; i++) {
    var px = map(i, 0, nDiagonals, x1, x2);
    var py = y + h;
    var qx = x1;
    var qy = map(i, 0, nDiagonals, y + h, y);
    b.line(px, py, qx, qy);
}
The map() function in p5, as it's name suggest, maps from one range to another. And in that manner we can position the lines across the width and the height of the rectangle in an even manner, such that they are parallel to the diagonal of the rectangle. Here x1 and x2 are the corrdinates of the left and right side of the rectangle, respectively.
To prevent a monotonous pattern that only flows in one direction we also flip the coordinates of the sides at random:
if (random(1.0) < 0.5) {
x1 = x + w;
x2 = x;
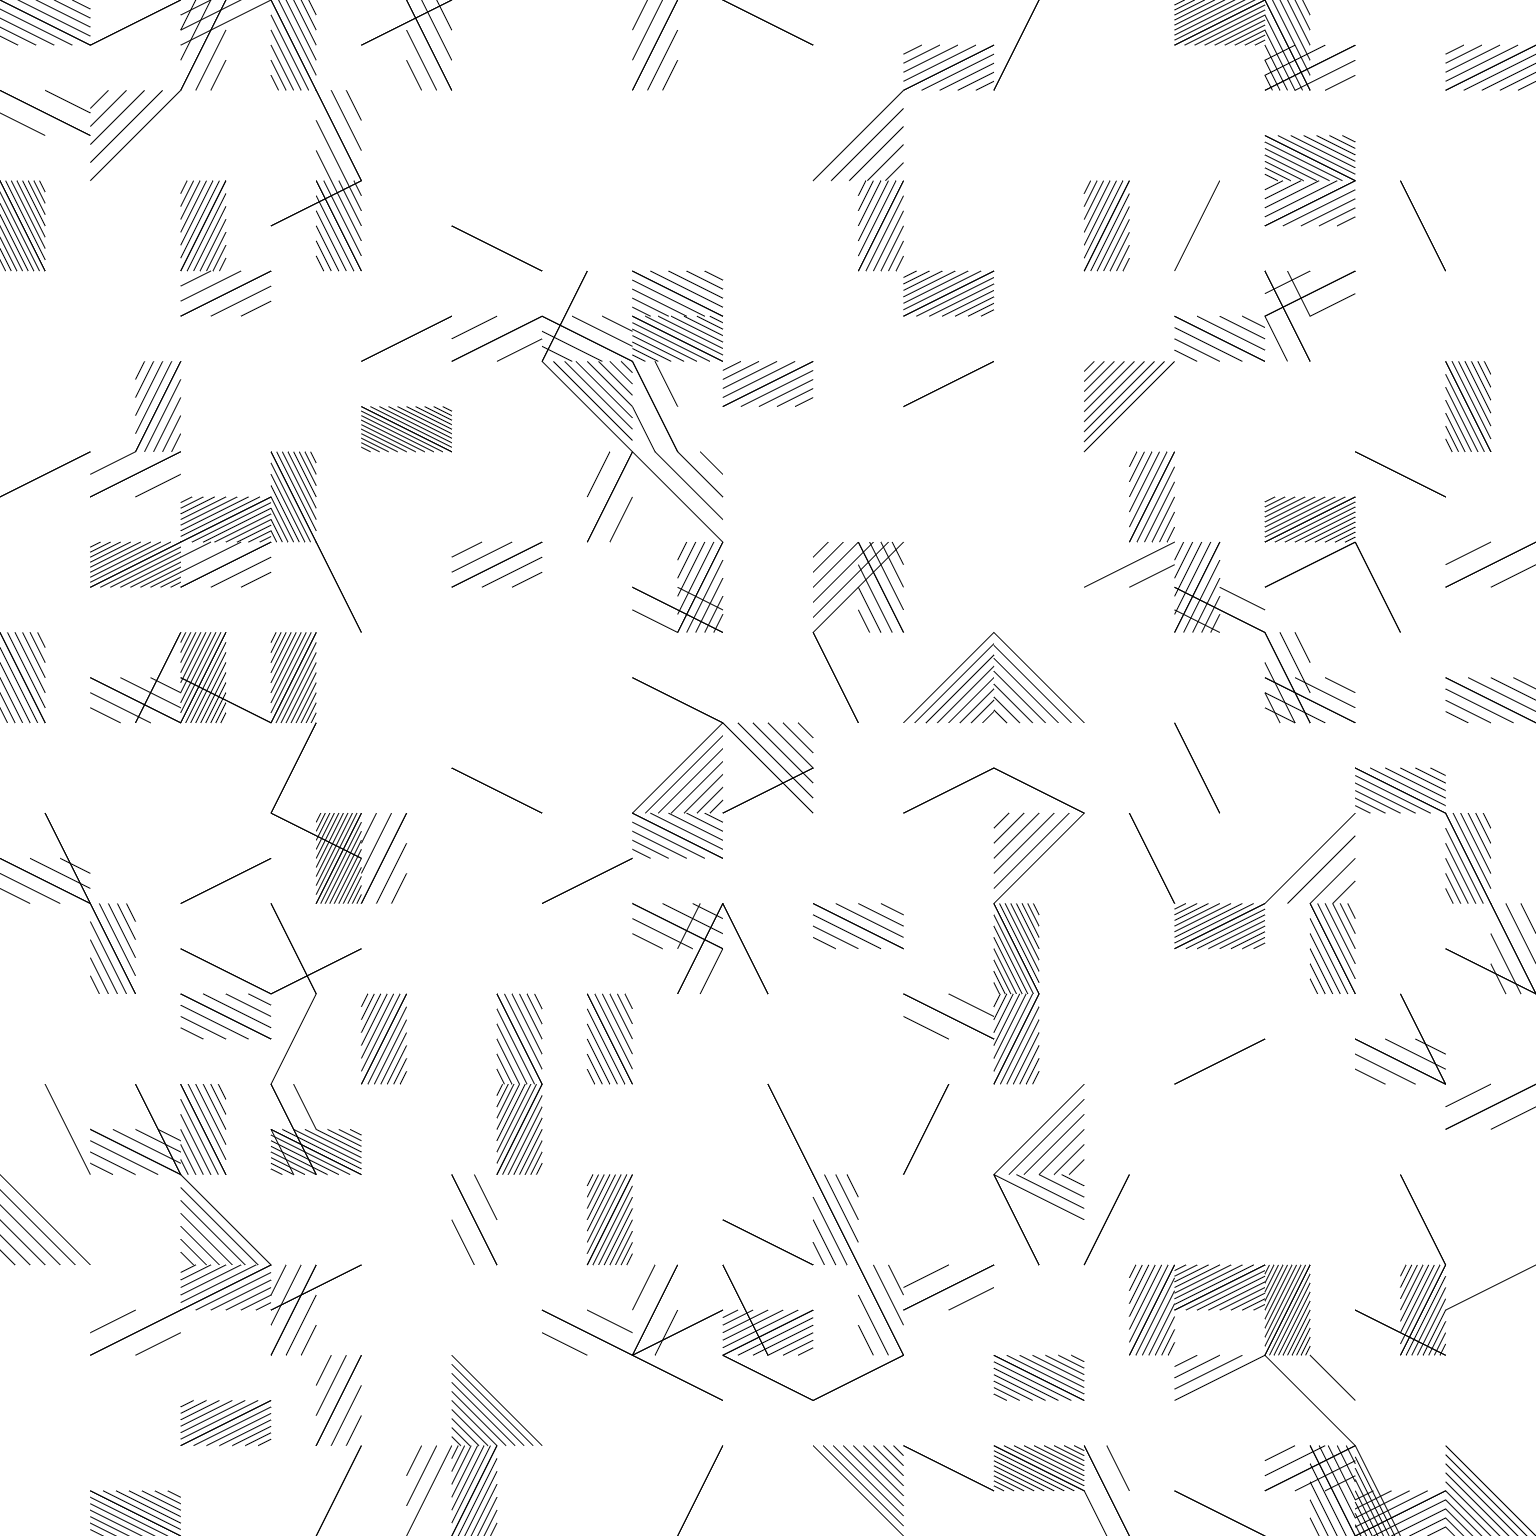
}It's easier to understand this by looking at an example. In isolation, and only for one of the two triangles the function would produce the following patterns:
Applying this to an entire grid of rectangular patches we would see the following patterns:
What's cool about this function is that:
- It works for arbitrarily sized rectangles. We'll mainly be dealing with rectangles that only take up half the size of a single patch.
- The diagonals at the very edge of the two triangles line up and overlap, producing a thicker and more pronounced main diagonal. Which is also something that occurs in Molnar's original artwork.
We still need to figure out the actual logic to generate the different patches that make up the final artwork, but the main piece of the puzzle has already been set.
Patch Logic
Essentially, Golan identified that there's 4 different types of patches:
- A patch that is split vertically into a left and right half.
- A patch that is split horizontally into a top and bottom half.
- A patch that has an L shape with two overlapping rectangles.
- A patch with one rectanglular shape and a triangular shape.
In this manner, each patch consists of two halves. There's also random chance that one of these two halves isn't drawn, this has the effect that the grid ends up being spacious.
The code for this can quickly get quite beefy, as there's many branches. To decide which type of patch we want to draw we can make use of a random variable:
var patternRand = random(0, 1);
if (patternRand < 0.25) {
	// draw patch type 1
} else if (patternRand < 0.5) {
	// draw patch type 2
} else if (patternRand < 0.75) {
	// draw patch type 3
} else {
	// draw patch type 4
}
Inside each one of these conditional branches we then need to account for the different variations of this particular patch type. For instance in the case where the patch is split horizontally, Golan uses the following code:
var cellRand = random(0, 1);
if (cellRand < 0.45) {
	molnarRect(xL, yT, cellW2, cellW); // L only
} else if (cellRand < 0.9) {
	molnarRect(xC, yT, cellW2, cellW); // R only
} else if (cellRand < 0.99999) {
	molnarRect(xC, yT, cellW2, cellW); // Both
	molnarRect(xL, yT, cellW2, cellW);
} else if (cellRand < 1.0) {
	// Neither
}
Which essentially lists out the four potential outcomes, with a very low chance for the last two options where both or neither rectangles are drawn.
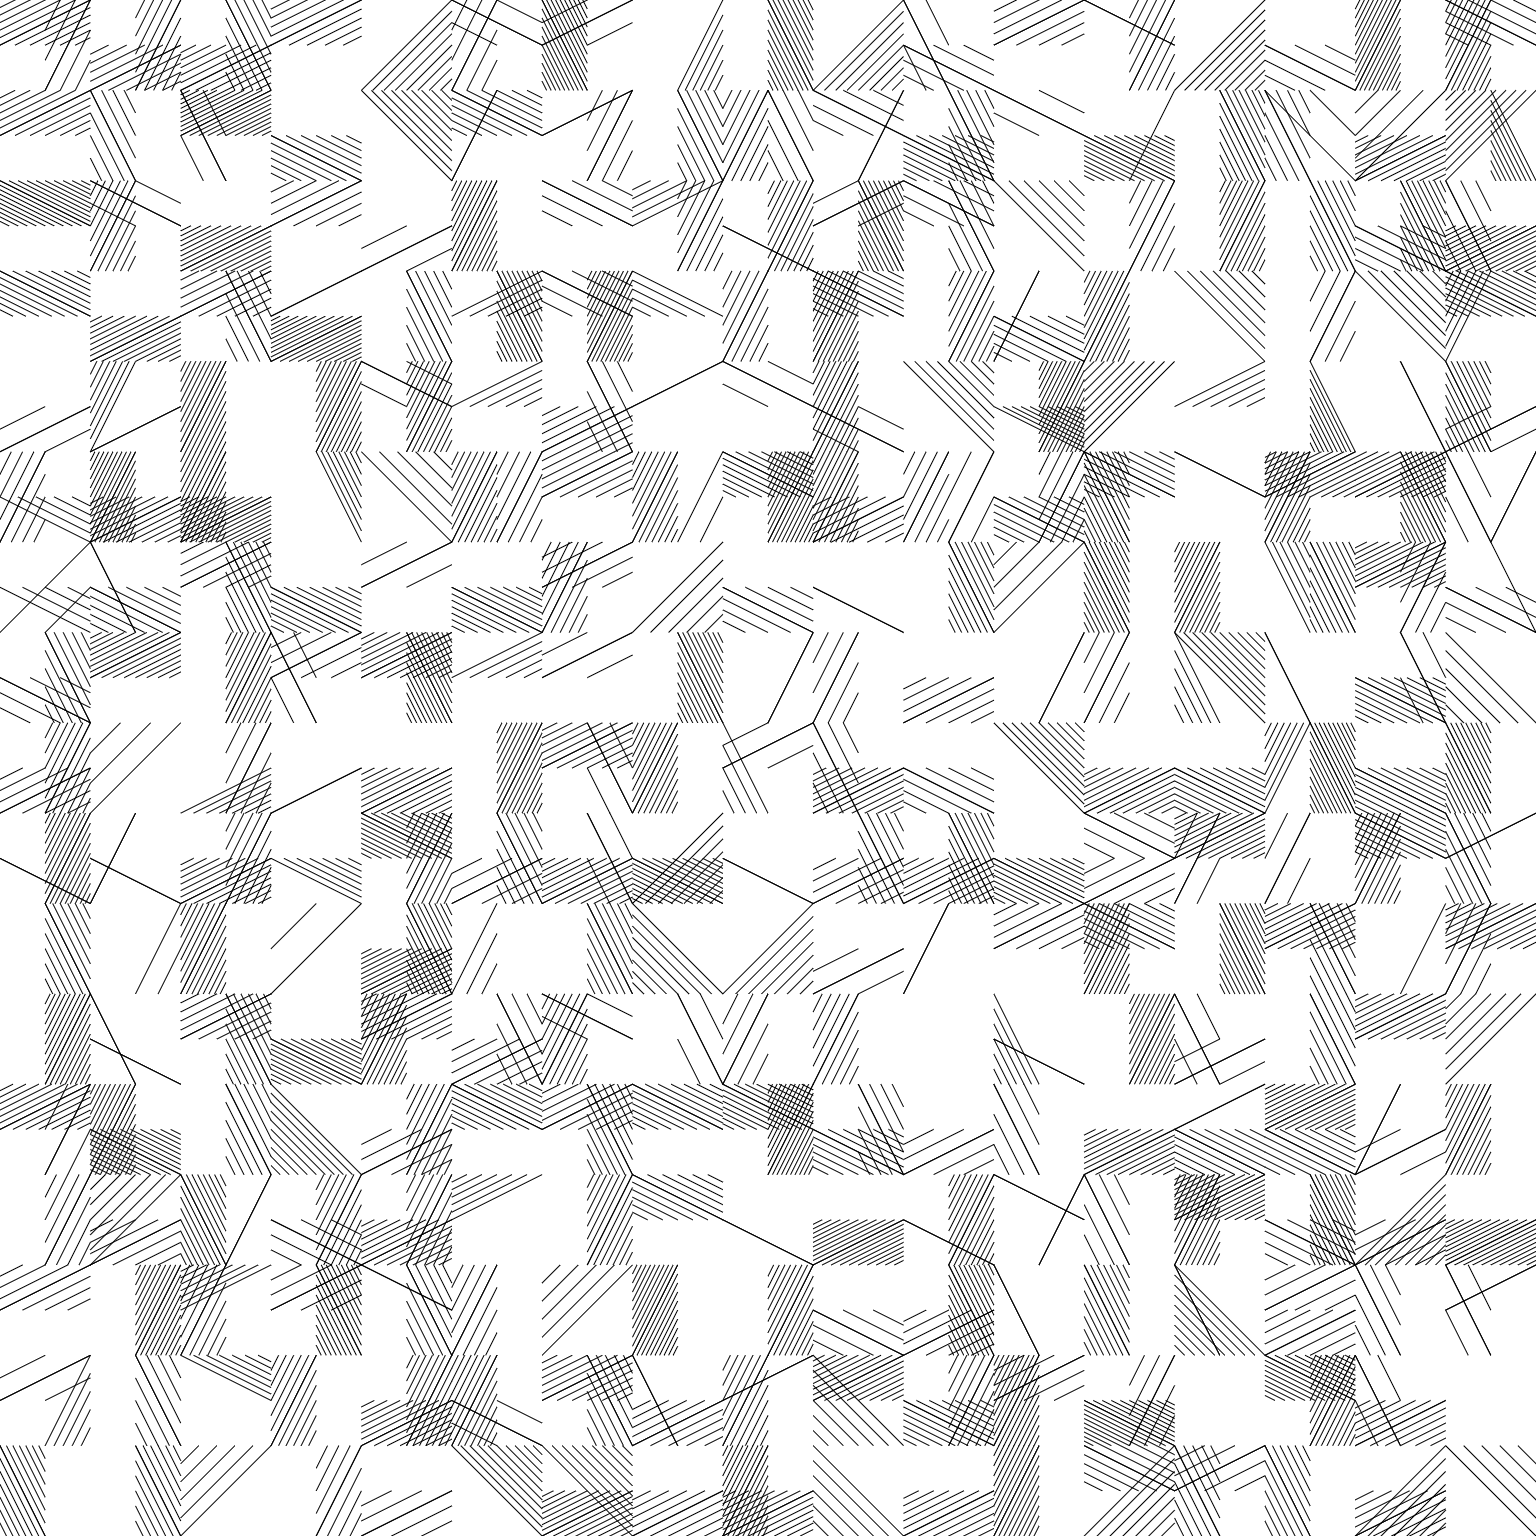
Putting it all together we get:
Closing Thoughts
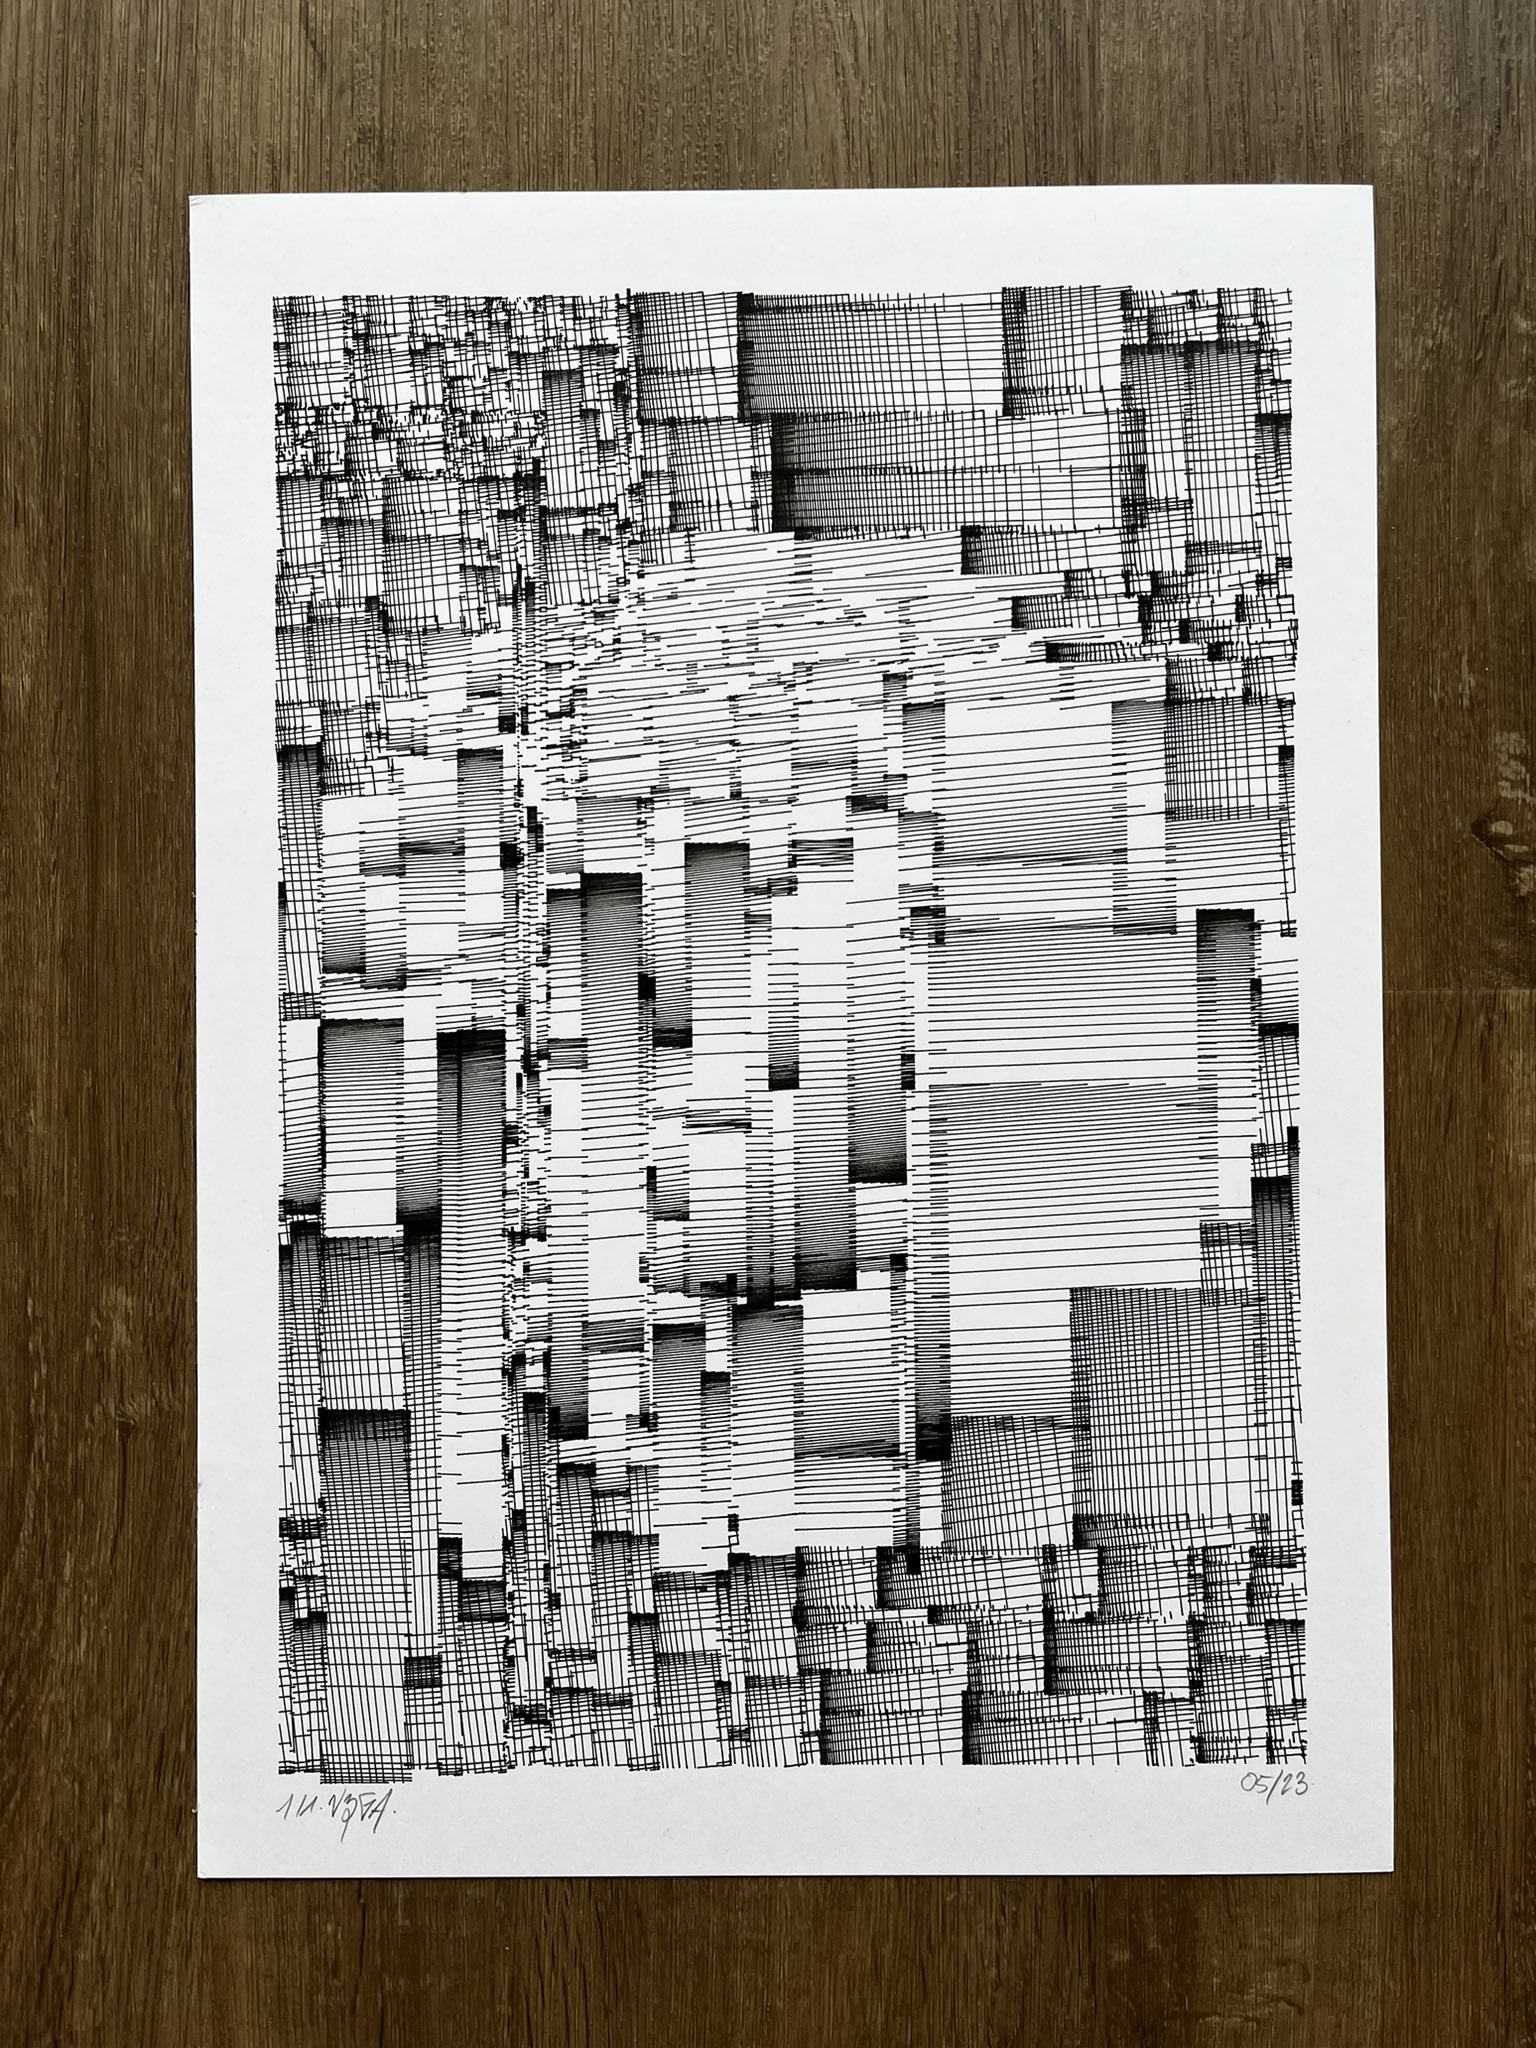
I also recreated the analogue version of the artwork, which turned out nicely in it's own way, but doesn't come very close to the original:
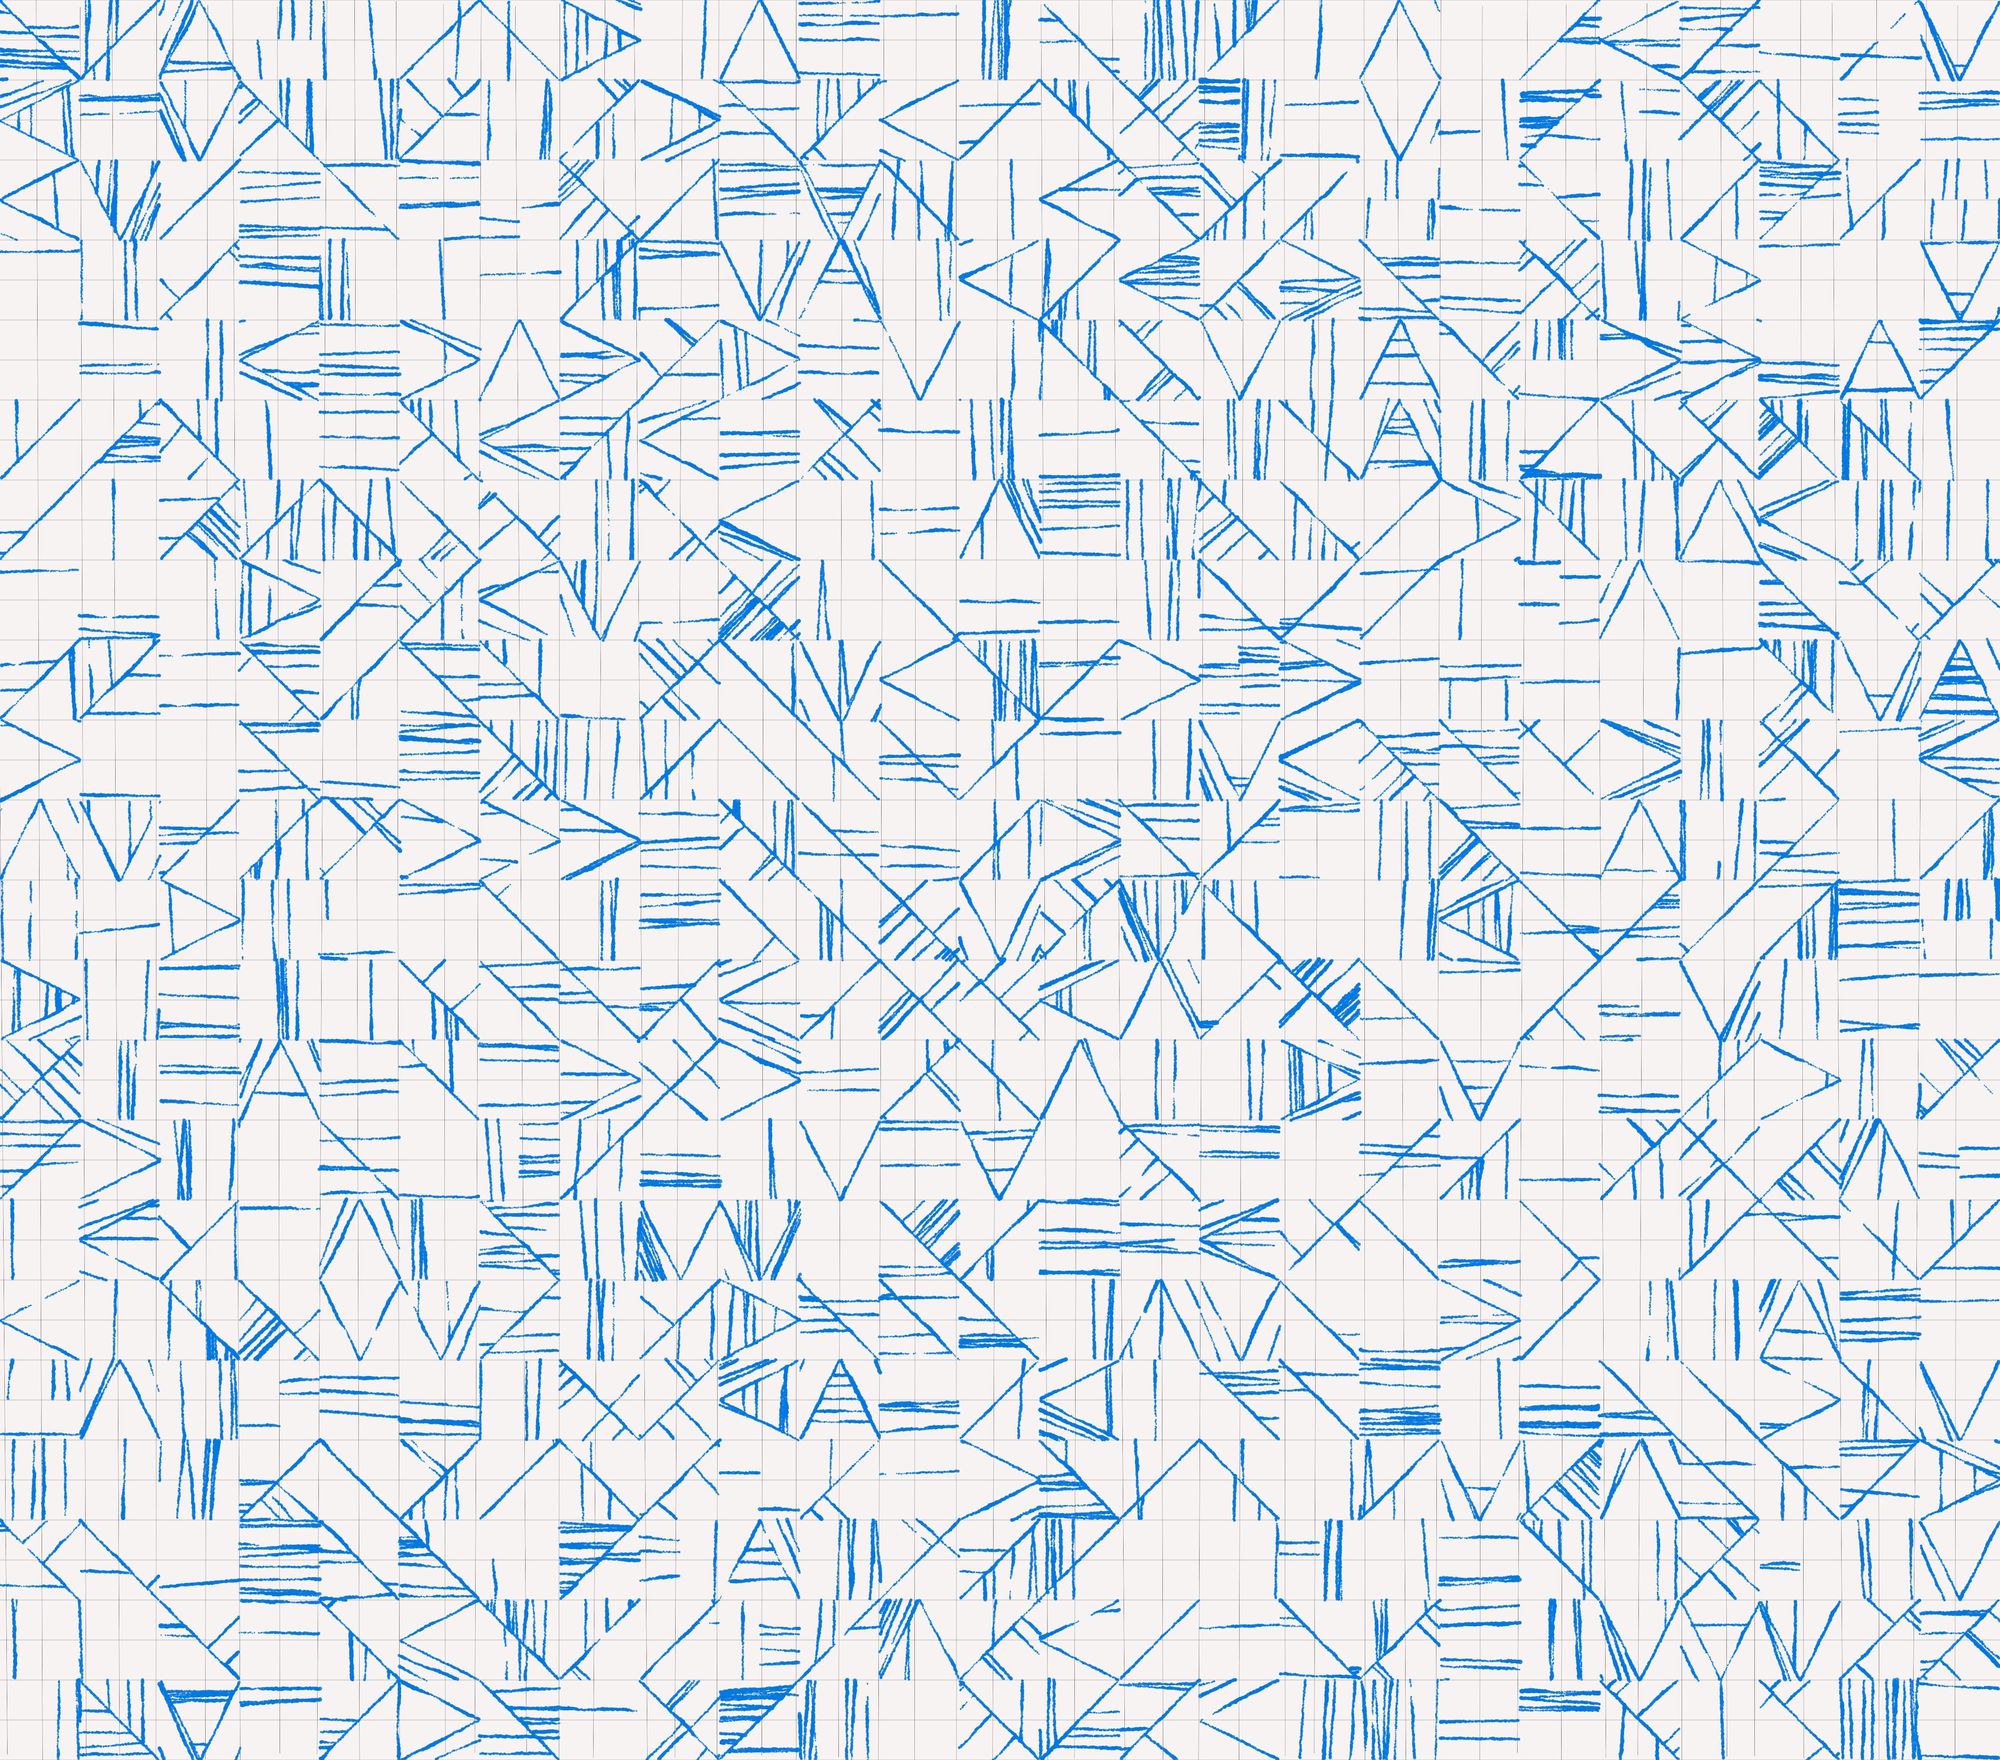
I initially wanted to write about this version but there's quite a few things here that will require their own explanations - and they're already in the works!
Anyway, I hope you enjoyed! And if you did consider sharing this post with friends or on social media, alternatively you can check out some of my other posts!