
In this blog post we'll recreate my Processing 20-th anniversary fundraiser sketch, step-by-step.
If you're viewing this on your mobile, hit the stop button for the interactive widgets to view the code!
- Creating a Grid
- Alternating Points and Circles
- Animating the Grid
- Distance Fields
- Adding Color
- Background Transparency Trick
Creating a Grid
The great Persian Polymath Al-Khawarizmi once said: 'Grids are awesome'! well maybe he didn't, but you can't prove that. That doesn't change the fact that grids are awesome. We'll start off by coding up a grid which we'll base our code on in later steps:
function setup(){
  w = min(windowWidth, windowHeight);
  createCanvas(w, w);
  strokeWeight(4);
  off = 50;
  spc = 10;
}

function draw(){
  background(220)
  for (x = off; x < w - off; x += spc) {
    for (y = off; y < w - off; y += spc) {
      point(x,y)
    }
  }
}
We have some boiler-plate stuff in the setup function, where we check for the dimensions of the containing window. We check if the height or the width of the window is smaller, to make sure that our sketch is always a square no matter the size of the containing window. Then we declare two variables off (for offset), and spc (for spacing) that let us manage how our grid looks.
The offset specifies how large the margins are with regard to the top, bottom and sides of our sketch, determining where ou grid actually starts and ends. The spacing variable simply tells out how spaced out the points in the grid are. The two variables come into action in the draw loop. This is my preffered way of making grids nowadays.
Alternating Points and Circles
The next step would be alternating between points and circles in our grid, this isn't necessary, we could perfectly do with just points, or circles, but it adds an interesting texture. It's also a little tricky to make the grid alternate between two different shapes. We can do that with if and else statements that check if the current coordinates are even or odd:
script src="//toolness.github.io/p5.js-widget/p5-widget.js">Alternatively, we could compress the entire if statement block into a one liner with ternary operators:
((x / spc) % 2 == 0)?((y / spc) % 2 == 0)?point(x,y):ellipse(x,y,5):((y / spc) % 2 == 0)?ellipse(x, y, 5):point(x,y)
Animating the Grid
We can make this grid much more interesting if we add some motion to it, which will give us something that is very similar to some of my earliest sketches from this year. We'll be modulating the strokeWeight of the draw points and circles with a sine function that takes as input their x and y coordinates, allowing us to obtain very interesting patterns:
The important line here is strokeWeight(4 + 4*sin(x/20+y/20+t)) which is doing all the heavy lifting. Here we're dividing by an arbitrary number to attenuate the effect of plugging in the x and y coordinates into the sine function. Try changing the numbers. Also try plugging in different combinations of x and y like x*y for example and see what patterns you get!
Distance Fields
In addition to plugging a specific value or coordinate into the modulating sine function, we could plug in a distance. For example, the distance of each point to the center of the sketch:
Equivalently you could add the distance to multiple points, in as follows:
d1 = dist(x, y, w / 2,w/2 );
d2 = dist(x, y, 100, 100);

sinin = t + d1 / 20 + d2/20;
Plug this into the sketch and see what you get! Lastly you could also make the distance point be the location of the mouse coordinates:
d1 = dist(x, y, mouseX, mouseY);

sinin = t + d1 / 20 + d2/20;
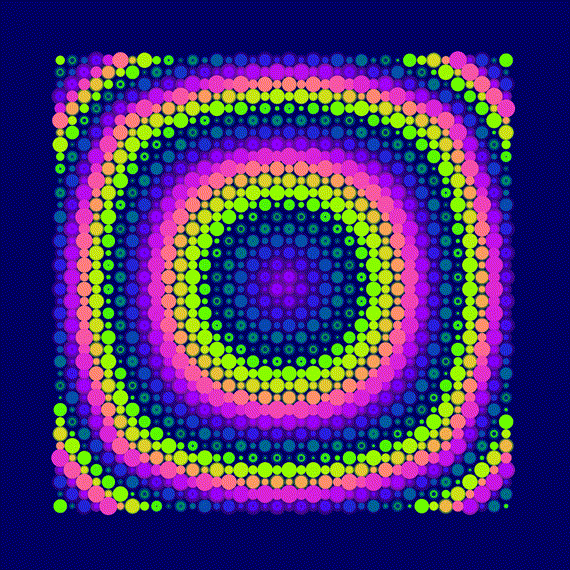
Adding Color
Instead of using premade color palettes, I enjoy plugging sinusoidal color into the RGB components of the stroke and fill functions. My current favorite palette is the following:
stroke(
  127.5 + 127.5 * sin(sinin),
  127.5 + 127.5 * cos(sinin),
  127.5 - 127.5 * cos(sinin)
);
This essentially bounces the RGB values in a very specific way between 0 and 255, generating pink, purple and green colors, that gradually interleave:
Go ahead and try plugging in different things in each one of the sine and cosine functions to see if you get a result that you like!
Background Transparency Trick
Here's a trick that I heavily use for my sketches, exploiting the transparency of the background color, for some pseudo motion blur:
background(0,0,0,20)
The transparency component also has a range that goes from 0 to 255. The lower you set it the more transparent the background. It's effect is hard to describe, but essentially it makes moxing shapes drawn to the canvas have colored smudgy trails. In other words, it takes stuff drawn to the canvas a little while before it disappears again. I also enjoy dark blue backgrounds over just plain black, since it visually works with the sinusoidal color palette:
And that's a wrap! If you enjoyed this post share it or leave me a nice comment! If you have questions also leave me a comment! Otherwise come join me on Twitter for more updates!