In this article we'll have a look at the making of Blöck, a customisable generative token on editART, a new genart platform on the tezos blockchain.
Blöck out! 🎉 #editart
— Ahmad Moussa || Gorilla Sun (@gorillasu) April 10, 2023
Thanks everyone for collecting! 🙌🙏 pic.twitter.com/DkRwIHtvqU
Starting from how I came across the platform by chance, to my sketching up initial ideas for the token, and ultimately releasing it on the platform!
Initial Inspiration
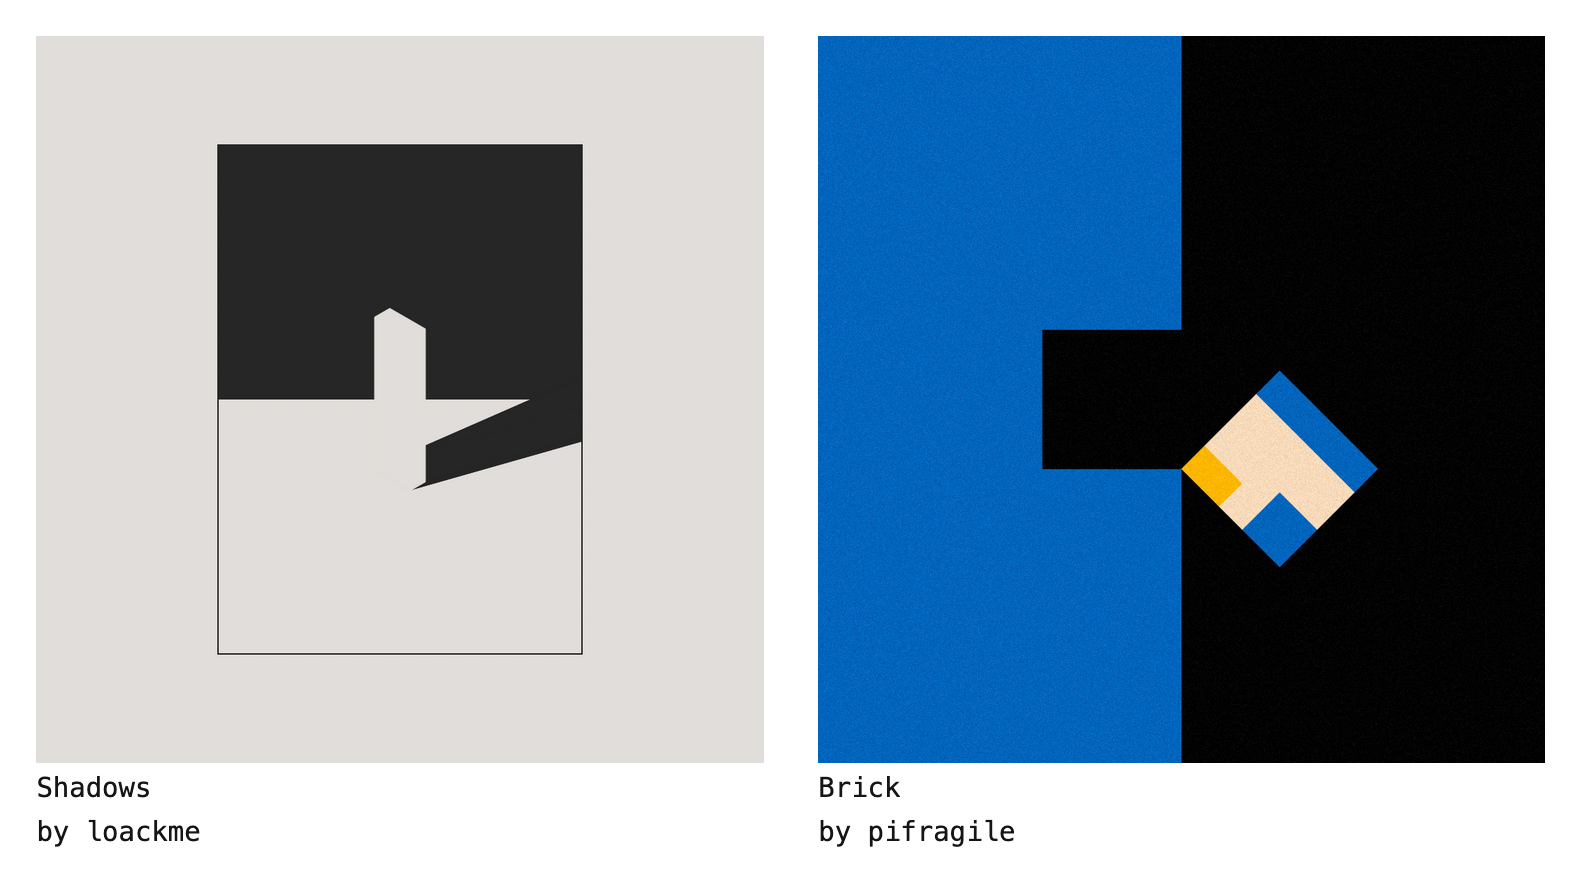
Blöck finds it's beginning with a tweet from generative artist loackme:
Announcing a new project on @editart_xyz
— loackme (@loackme_) March 25, 2023
Shadows
100 ed, 3 tez
Customize your mint using 5 sliders!https://t.co/yVQiJTeqoL pic.twitter.com/SOjklQ4Zs9
If you haven't come across editART.xyz yet, on Twitter or elsewhere: it's a new generative art platform on the Tezos blockchain developed by Piero aka pifragile.
Similarly to FxParams, FxHash's new parametric method of minting, on editART the collector also tweaks the artwork prior to minting, essentially becoming a co-creator of that specific iteration. This is done via 5 mandatory sliders, each of which controls a specific parameter in the code.
After checking out loackme's token, and exploring the platform a bit more, I found myself on the github page that contains instructions and the template for creating projects on editART. I quickly cloned the repo and started playing with the template, and testing out ideas in the sandbox. The process was relatively streamlined, what I found really is that the sandbox takes a link to your project running on a local server, making it really simple to test things without having to install anything.
First Ideas
After a little bit of brainstorming I decided to reiterate on some partitioning code that I had written last year, which resulted in the following sketch:
Partitions #p5js #creativecoding pic.twitter.com/SN5x9N6nLJ
— Ahmad Moussa || Gorilla Sun (@gorillasu) March 27, 2023
I felt that this idea was solid, but ultimately I couldn't find any interesting mapping between the 5 sliders sliders and sketch parameters.
I decided that I was going to leave the partitioning idea for another day, and found myself coming back to experimenting with grids. One consideration for the token, was that I wanted it to be aesthetically simple, and somewhat fit in with the already existing projects on editART, like loackme's and Piero's tokens.
What's more, is that grids are an idea that I always find myself coming back to when I don't really have a game-plan. Blöck is actually similar to a sketch I did back in Genuary 2023, but I didn't want to repeat myself and reuse the irregular grid code that I had already used so many times:
My kid could have made that #genuary #genuary26 pic.twitter.com/J0TQf3Ef7c
— Ahmad Moussa || Gorilla Sun (@gorillasu) February 2, 2023
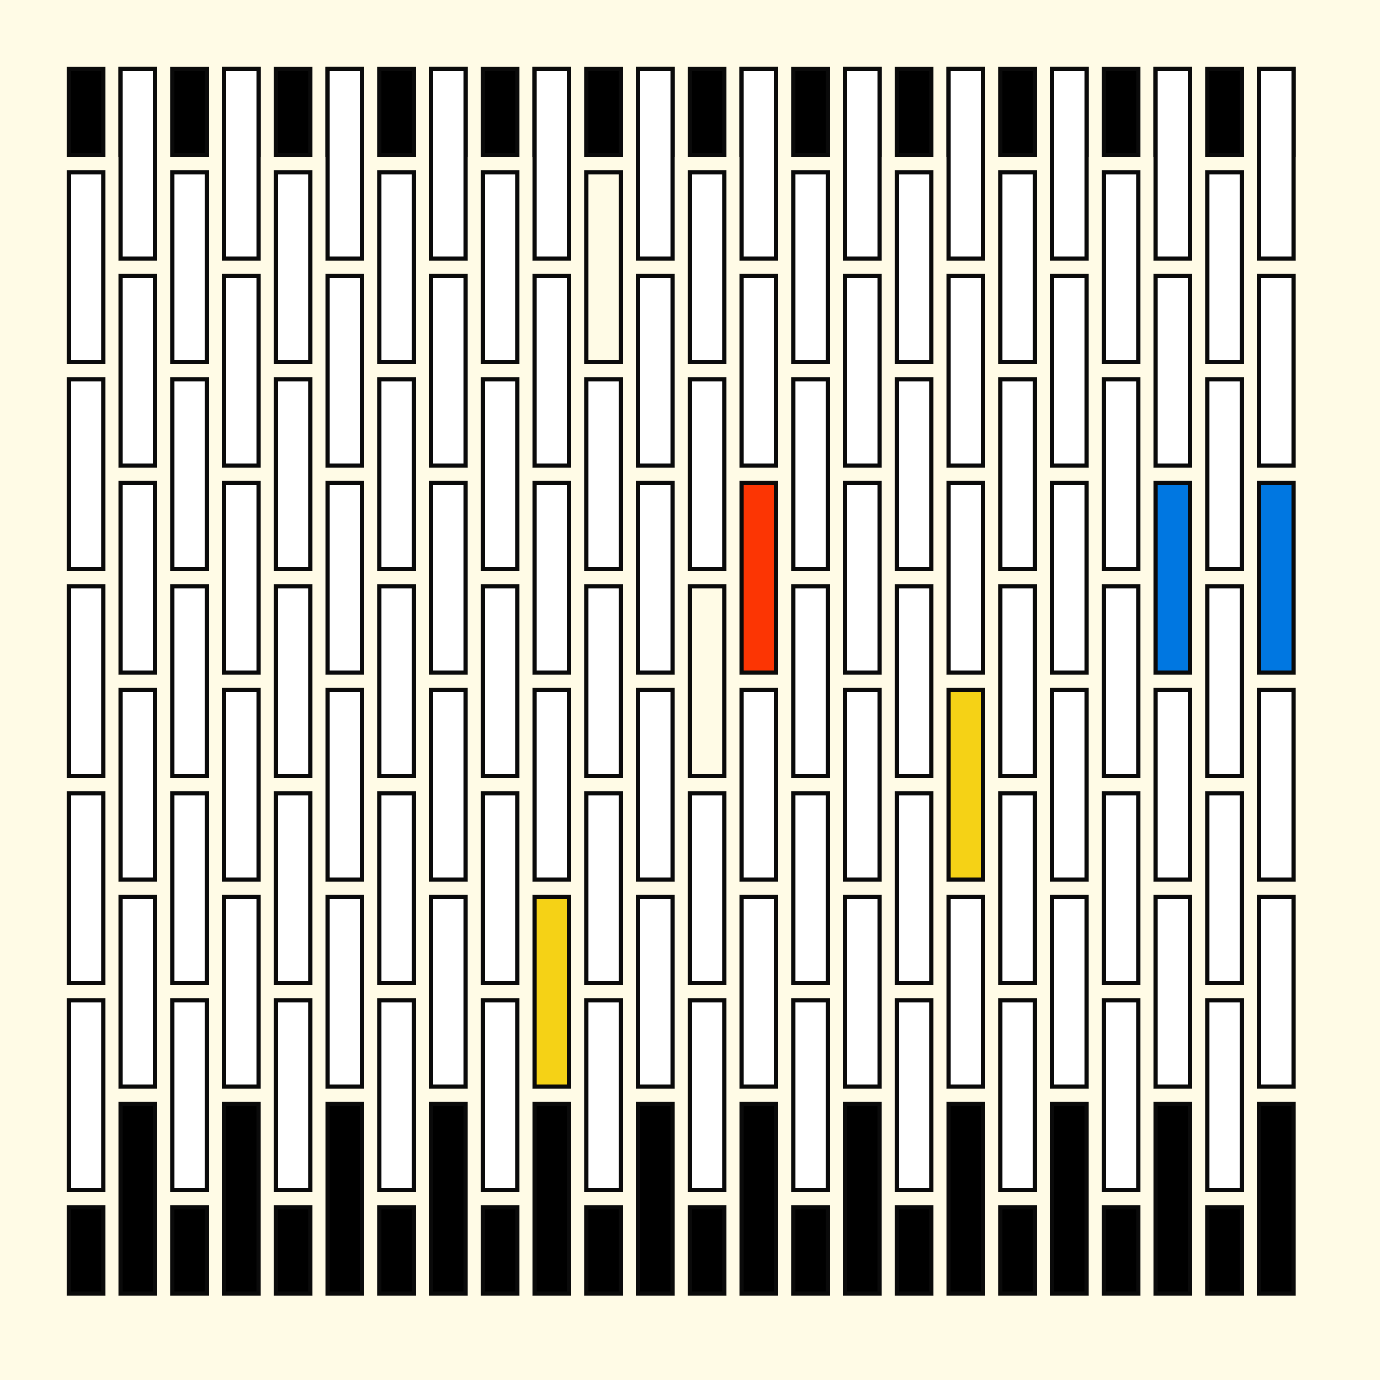
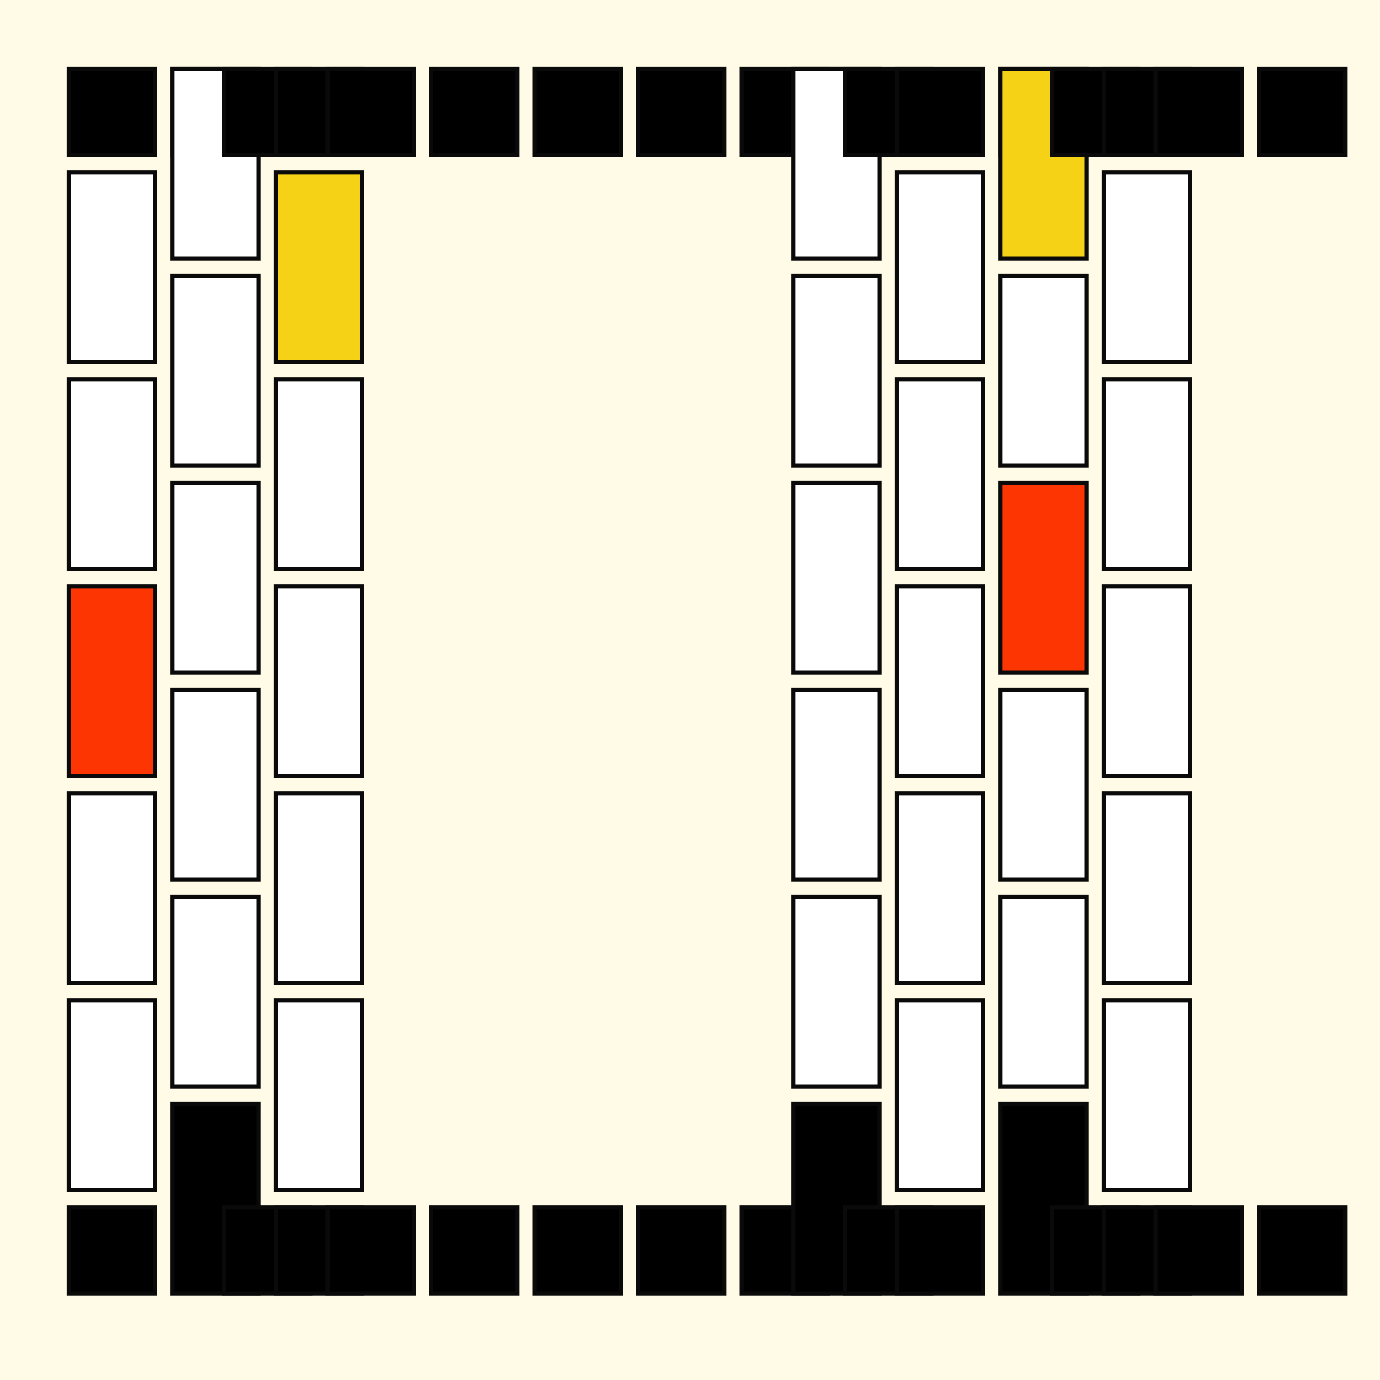
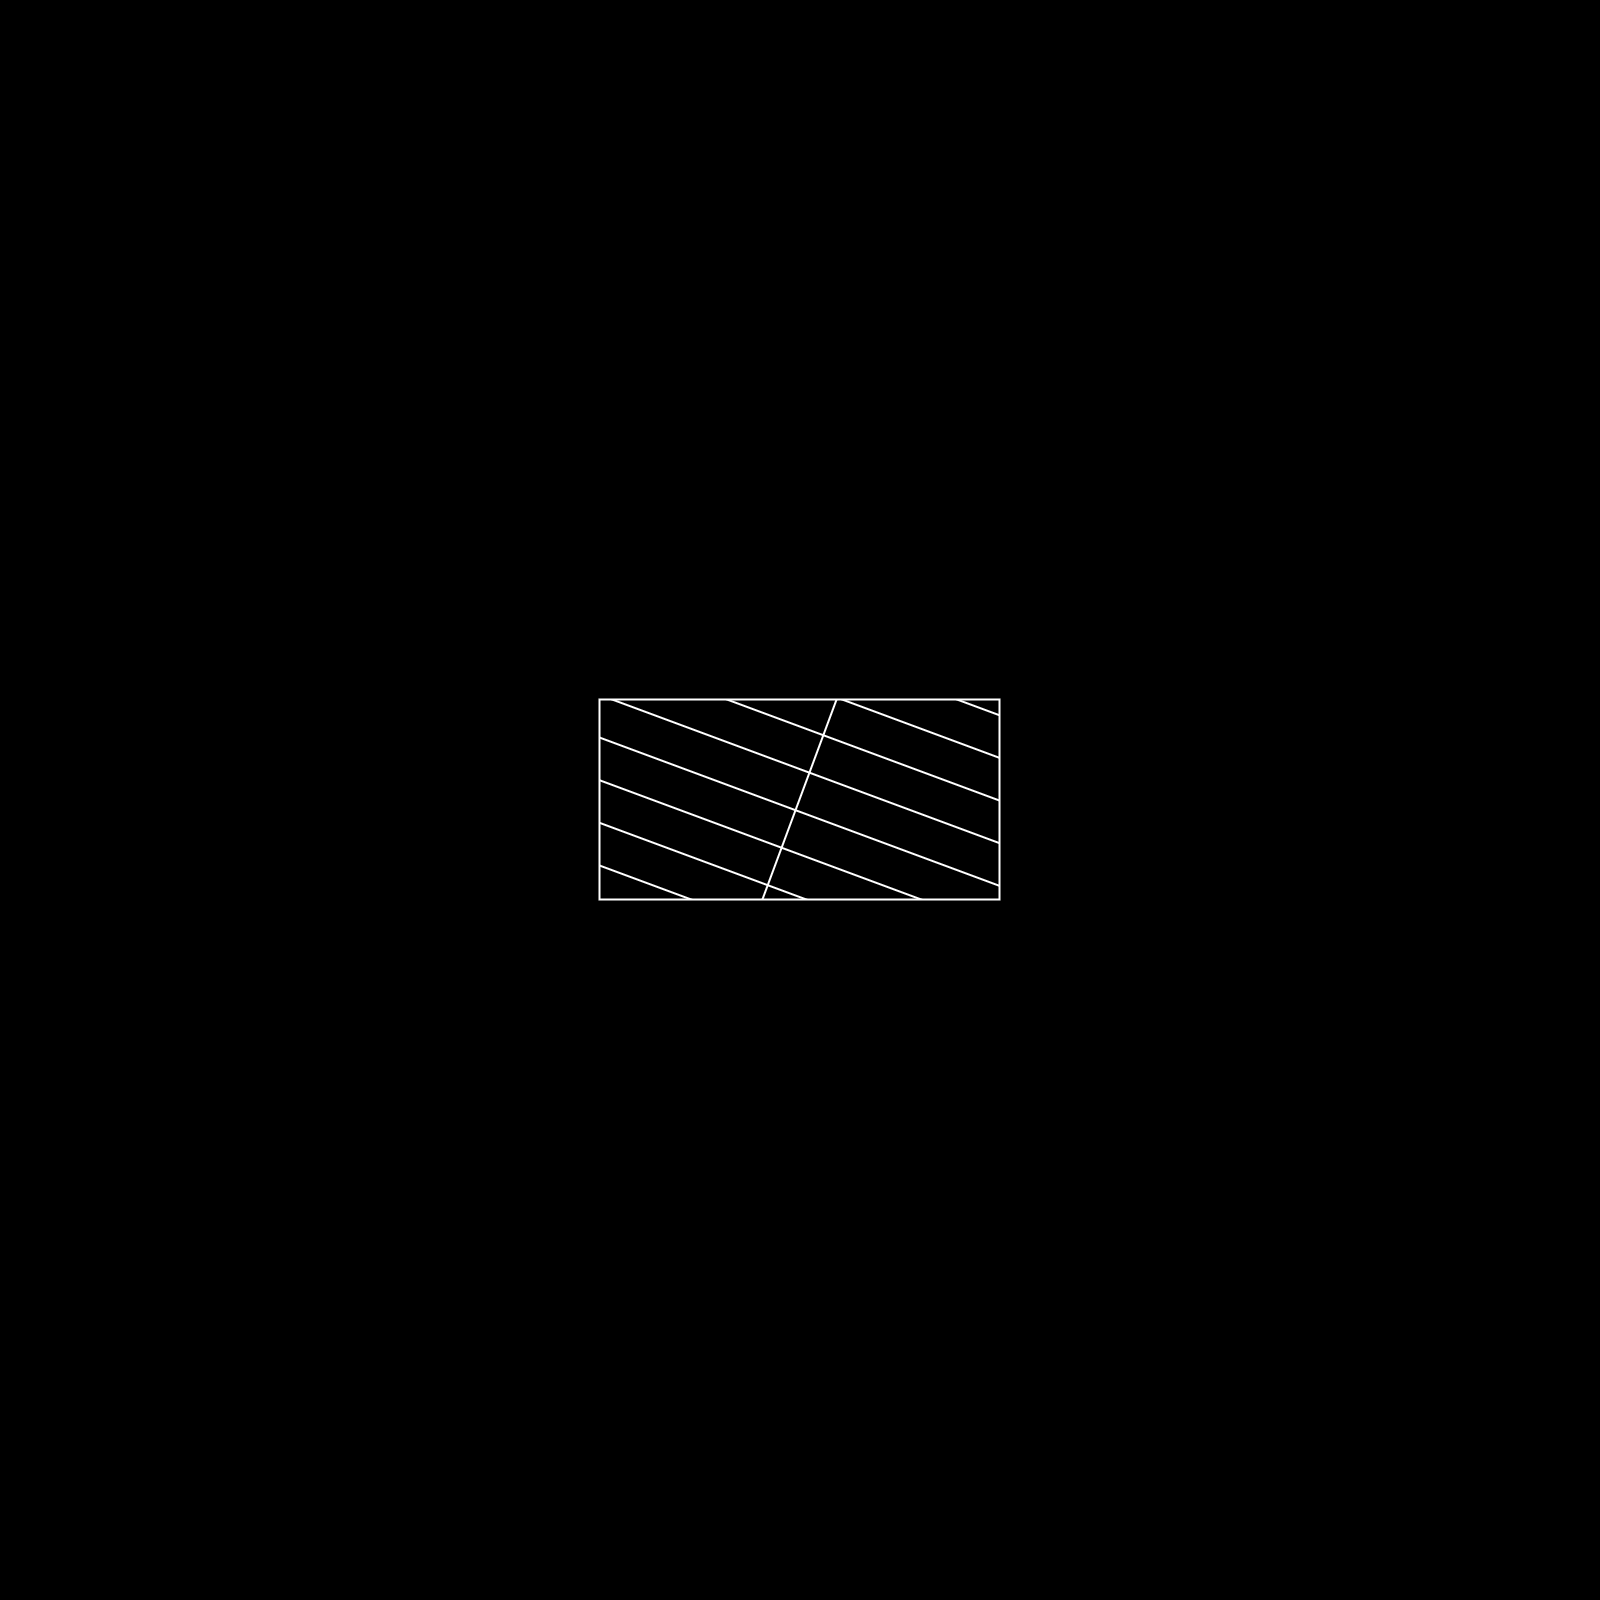
Starting out from a fresh slate, in the attempt to make something that looked like a checkerboard, this pattern manifested itself on my canvas:

The code for this is pretty straightforward:
let PAD = 100 // padding between grid and canvas border
// number of tiles horizontally and vertically
let X = 12
let Y = 12
// horizontal and vertical dimensions of the tiles
let x_spc = (canvas_size - PAD*2)/xs
let y_spc = (canvas_size - PAD*2)/ys
// loop that computes the actual positions and draws the tiles
for(let x = 0; x < X; x++){
for(let y = 0; y < Y; y++){
/*
code that fills and colors the tiles with patterns goes here
*/
if(y>0 && (x+y)%2 == 0 ){
pg.rect(
PAD + x * x_spc,
PAD + y * y_spc-y_spc,
x_spc,
y_spc*2 // multiply by two
)
}else if(y==0 || y==ys-1){
pg.rect(
PAD + x * x_spc,
PAD + y * y_spc,
x_spc,
y_spc
)
}
}
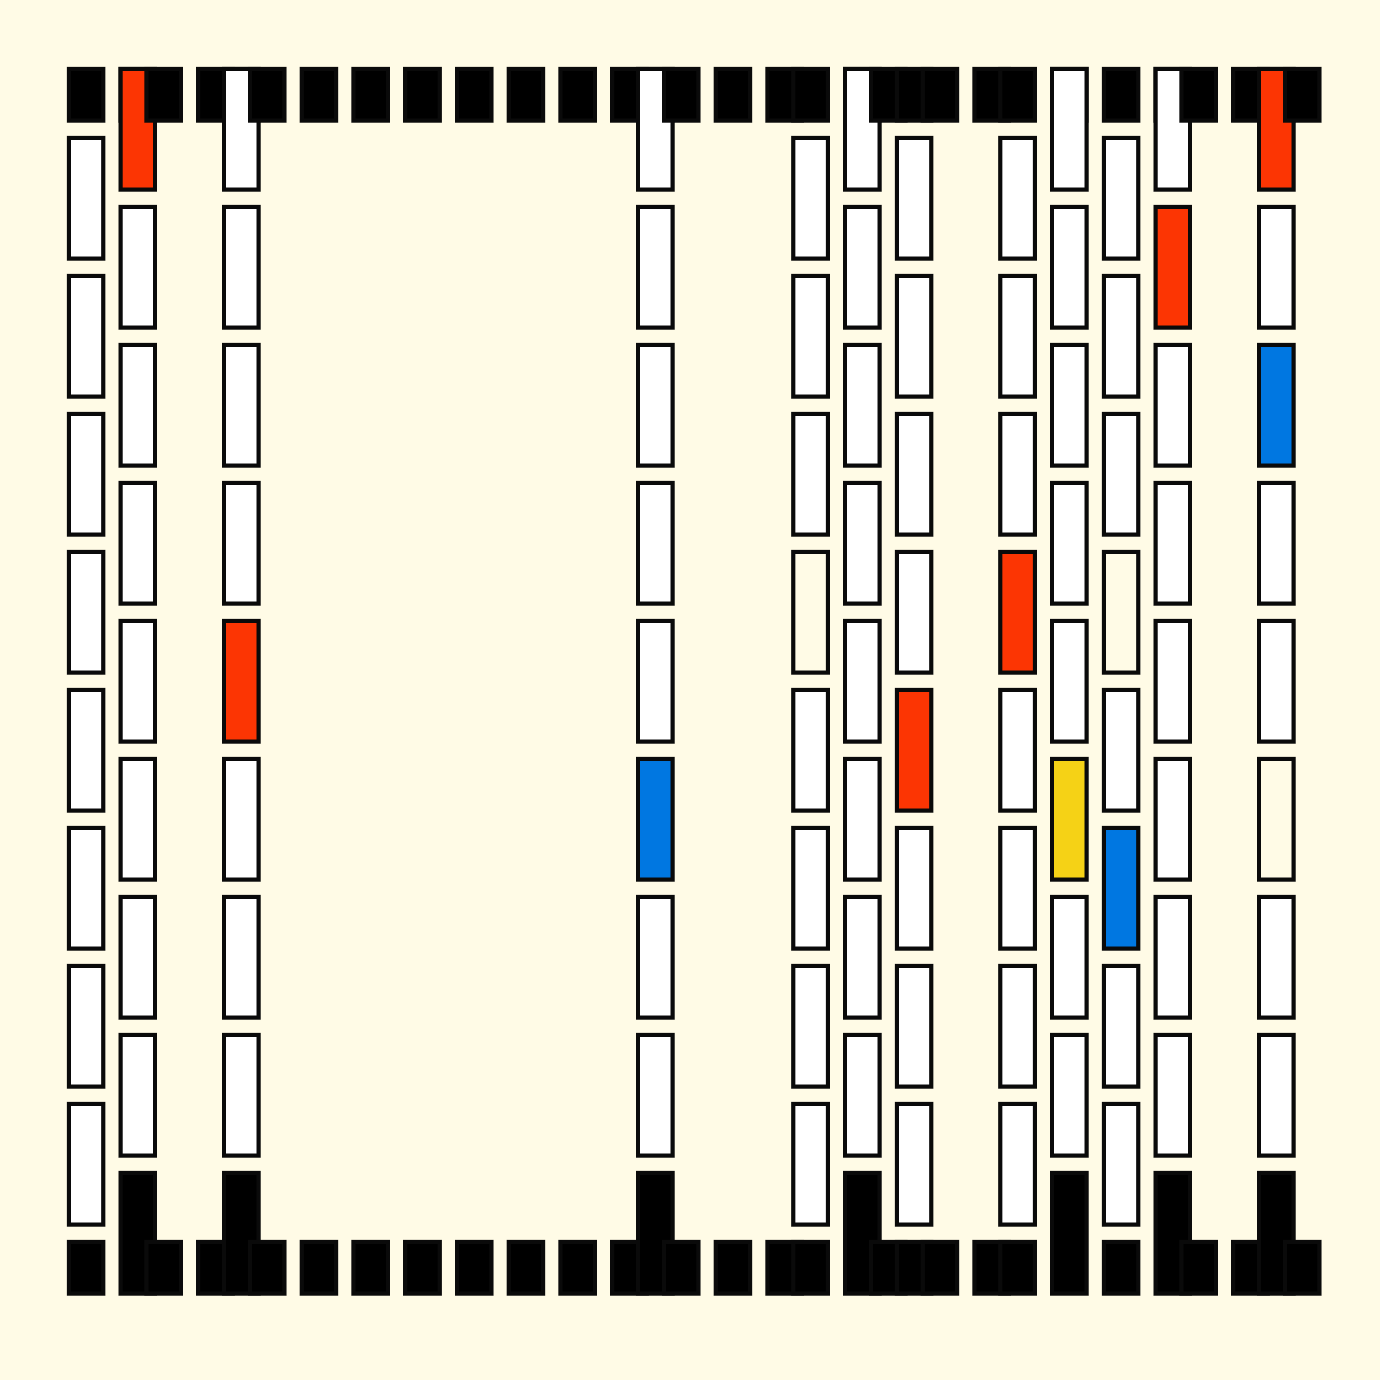
}The trick that creates the grid is checking whether the sum of the tiles' horizontal and vertical index is even or odd: when this sum is odd we draw a long tile, otherwise we don't. Except if it's a tile at the very top or the very bottom of the grid, then we do draw it. This way we get this nice interweaving raster. Here's some variations:
If we were to only check for the vertical index we wouldn't get the alternating pattern:
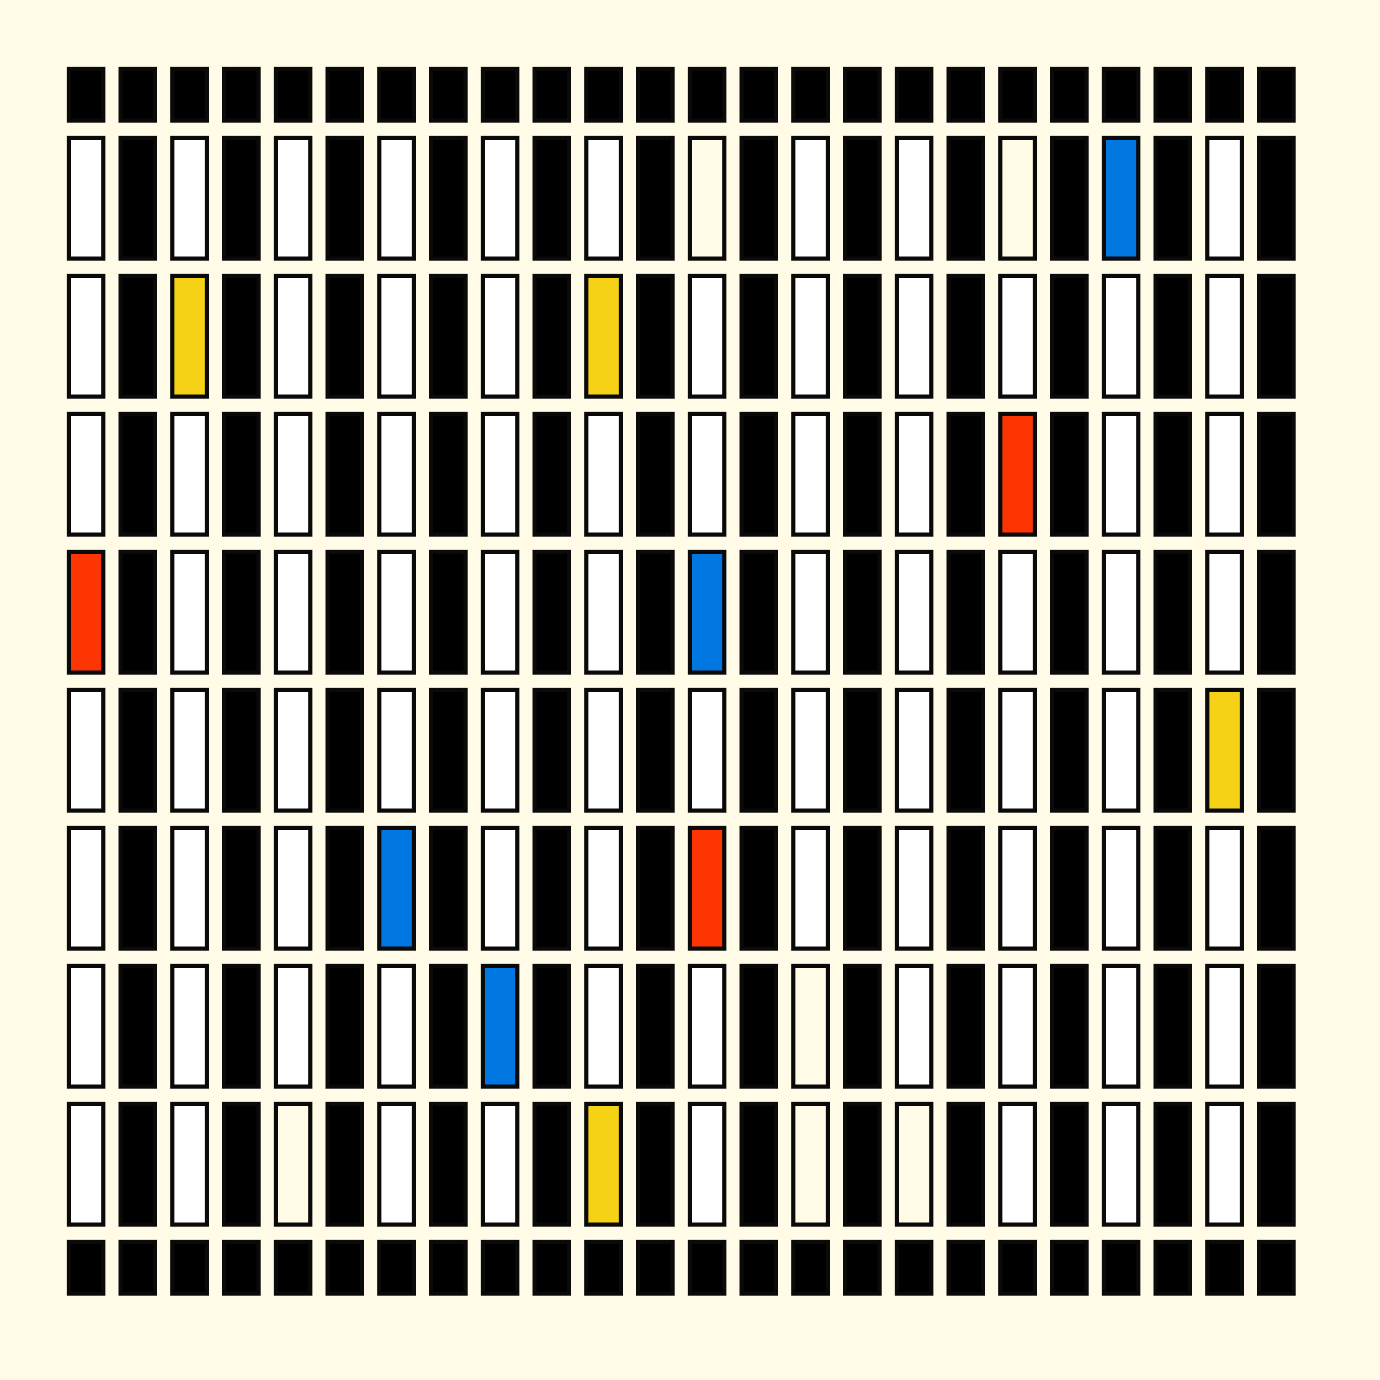
But this idea was still a bit too simplistic for the purpose of a generative token.
A different kind of Grid
Looking back at the code, I don't remember why I did it, but I replaced the outer loop's update rule/increment statement, whatever you wanna call it, with a random increment:
for(let x = 0; x < X; x+= random([.5, 1])){}
This breaks the sketch and leaves horizontal gaps in the grid because the conditional statement in the loop's body doesn't trigger anymore:
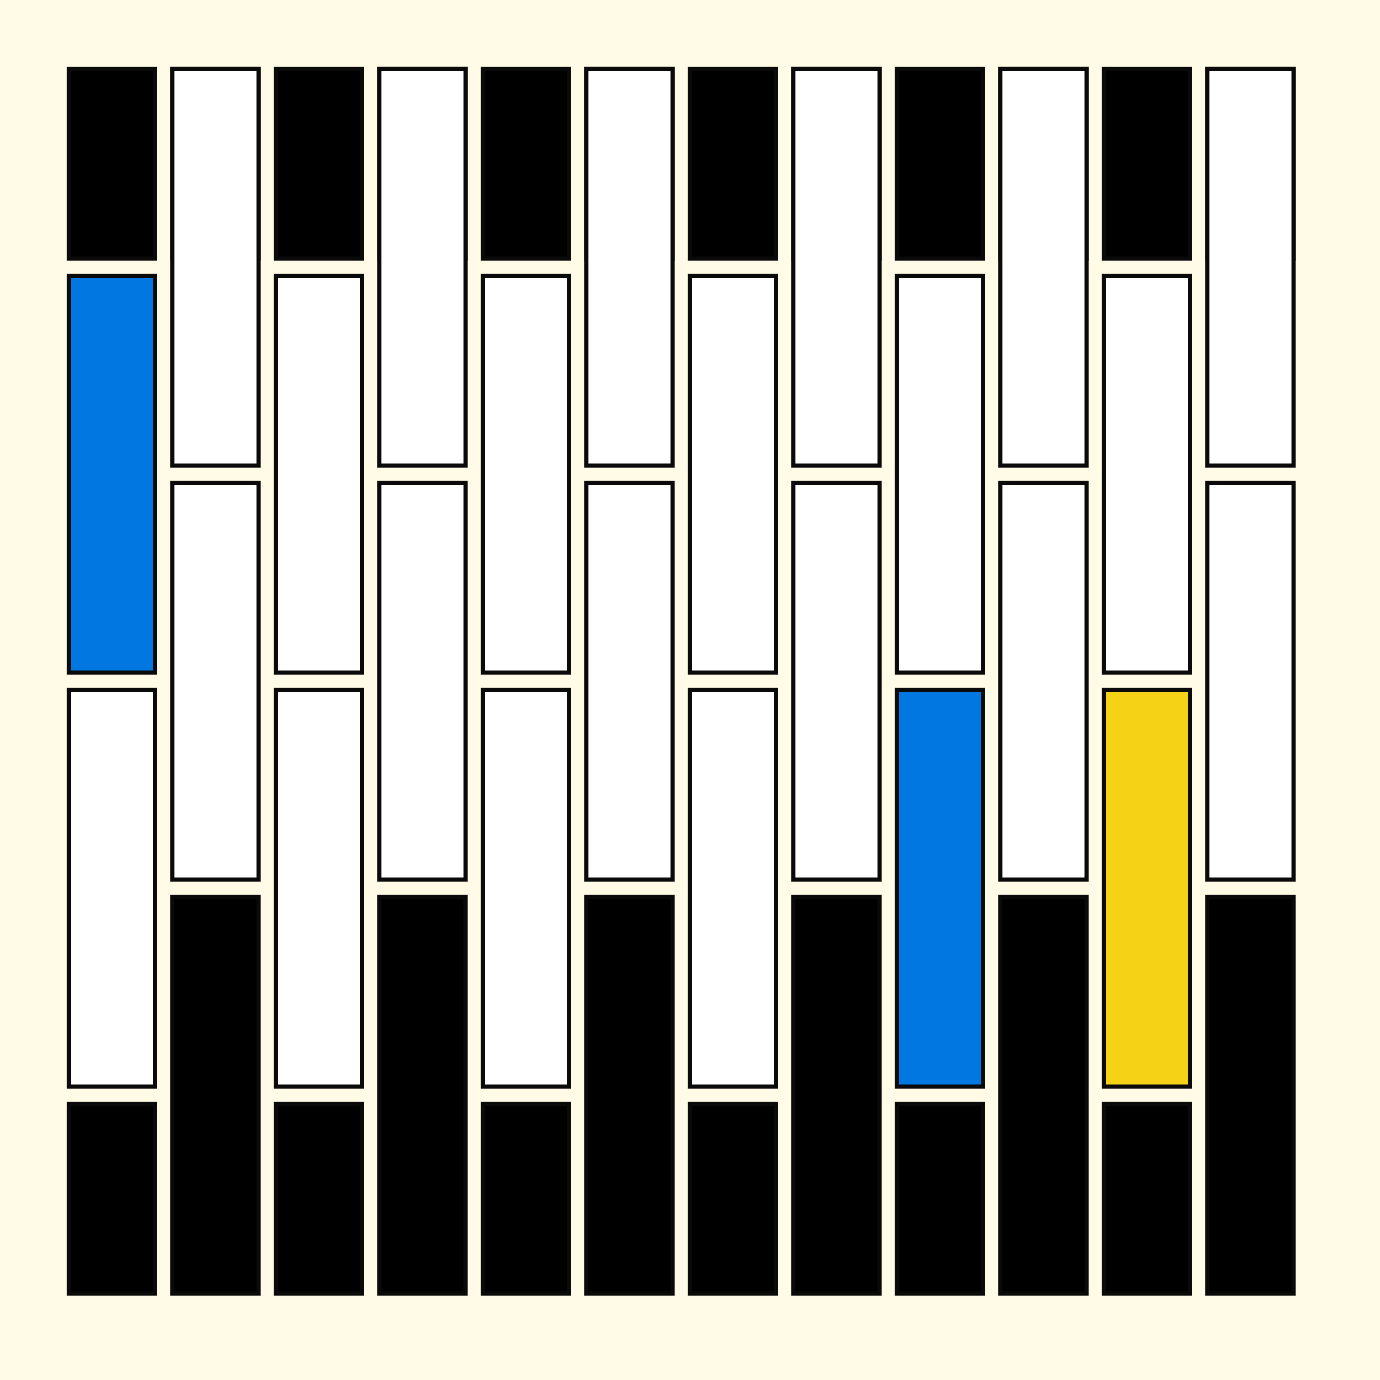
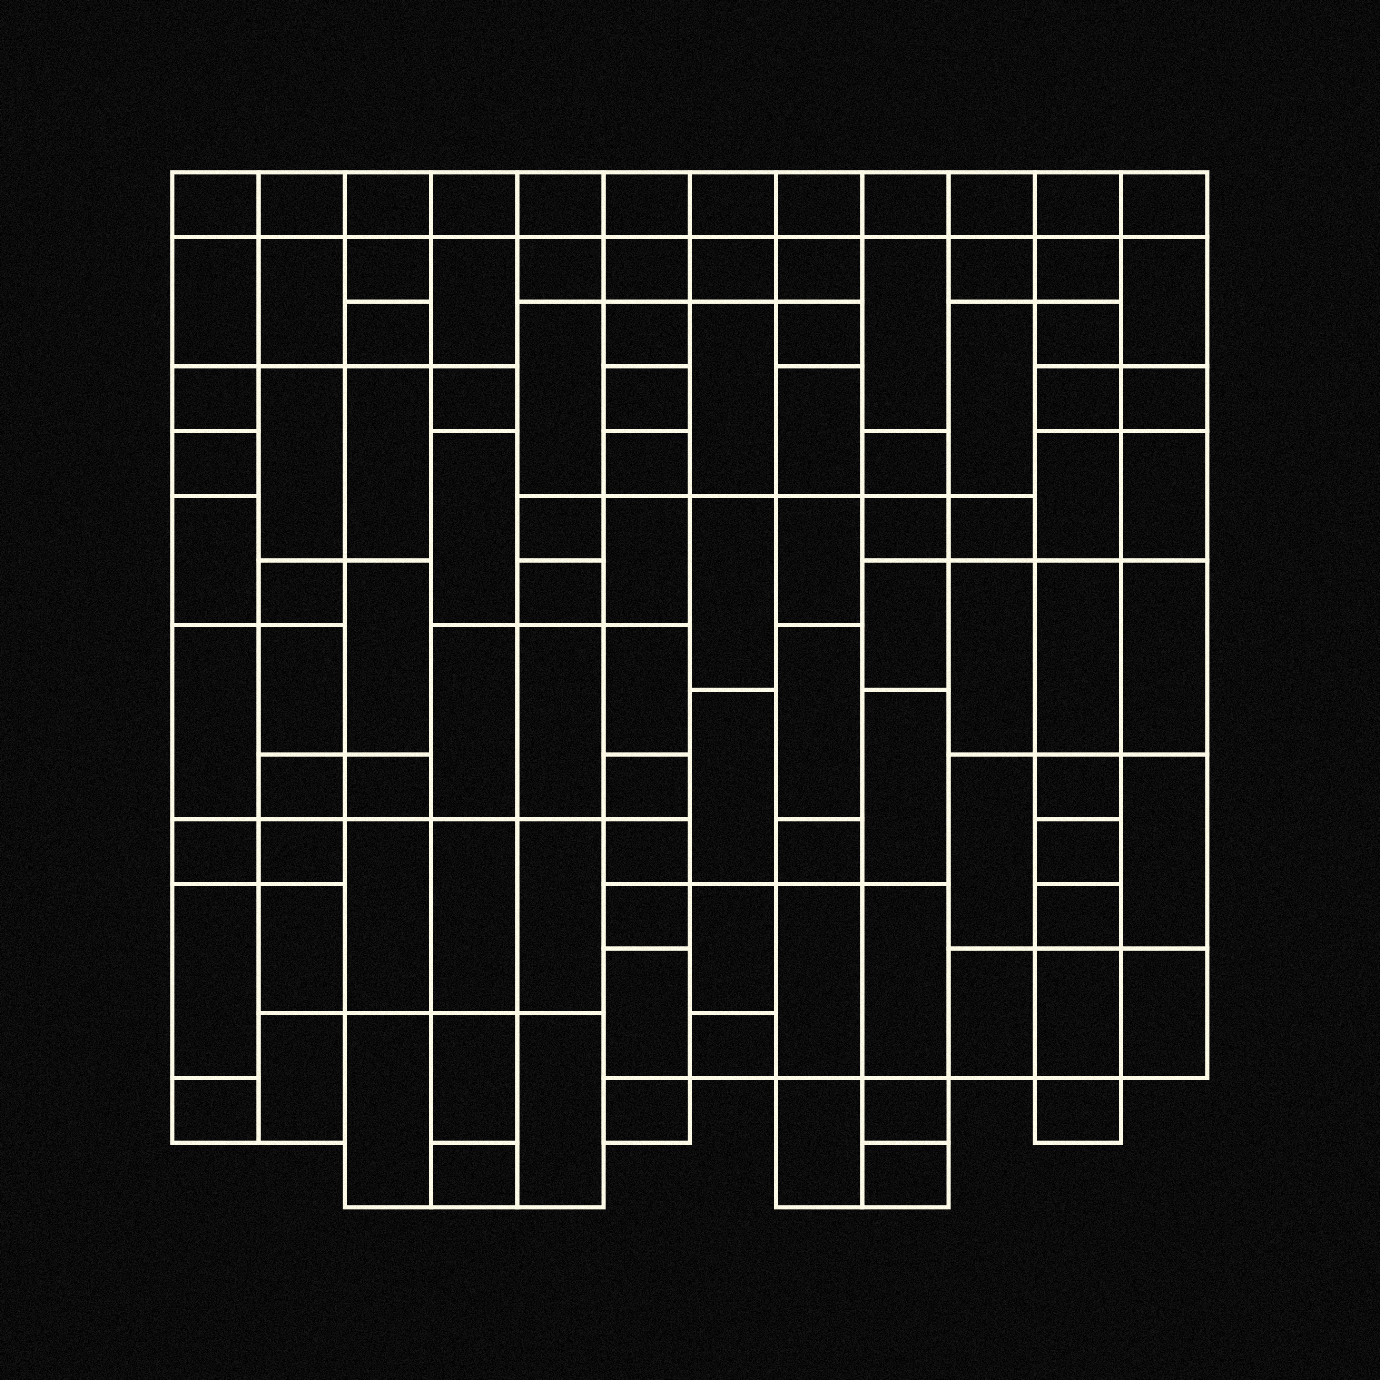
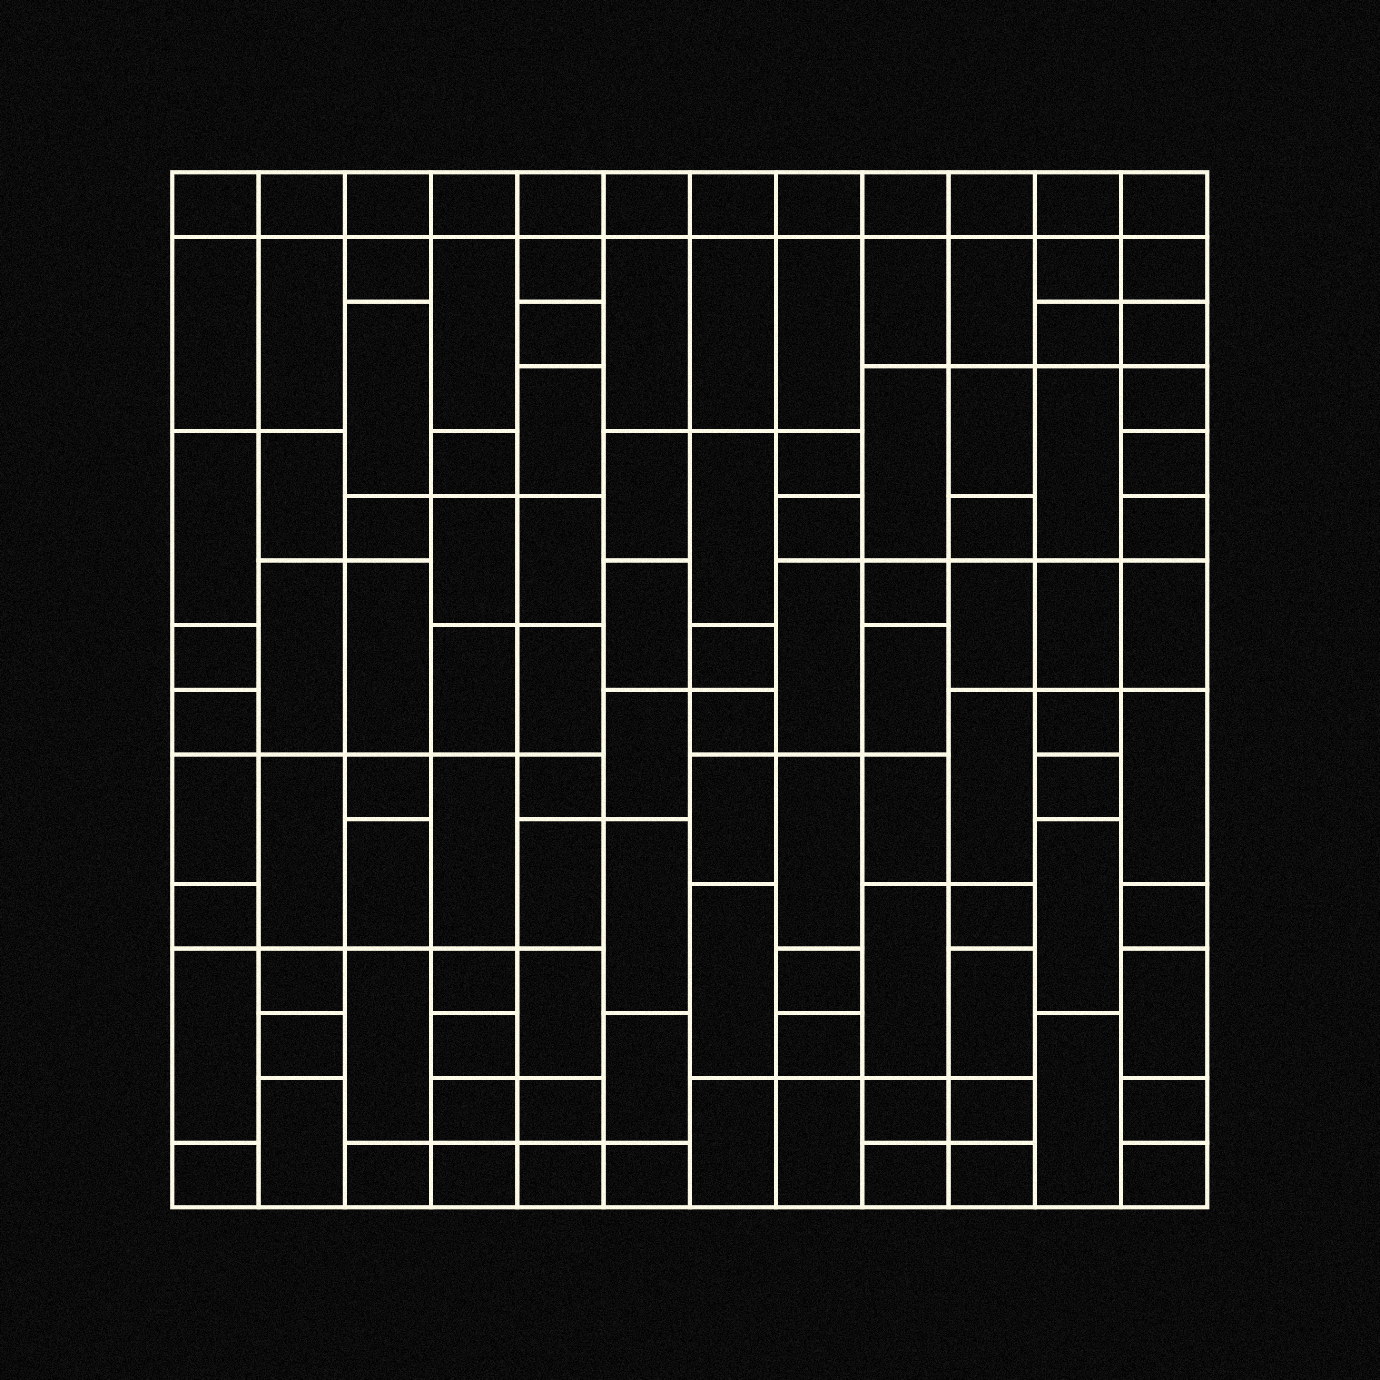
This however sparked an idea: what if the update rule increments the loop counter with differently sized steps at every iteration? I tried this with the vertical increment of the inner loop first, obtaining this pattern:
We essentially modify the loop such that it jumps several steps ahead at any given iteration:
for(let y = 0; y < Y; y+=stepy){
	pg.rect(
		PAD_X + x * x_spc,
        PAD_Y + y * y_spc - y_spc*stepy + y_spc,
        x_spc, y_spc*stepy)

	// in this case there's only 3 possible increments
	// but the steps can be anything for different variations
    stepy = random([1,2,3])
}
In this setting we also need to calculate the correct size of the rectangles. Additionally, to make the increments fill out the entire height of the grid, we also need to detect the last upcoming iteration, which can be done by checking if the loop's stopping condition would trigger in the next iteration. In that case we simply set the increment to the smallest possible step value:
if(y + stepy >= ys){
  stepy = 1
}
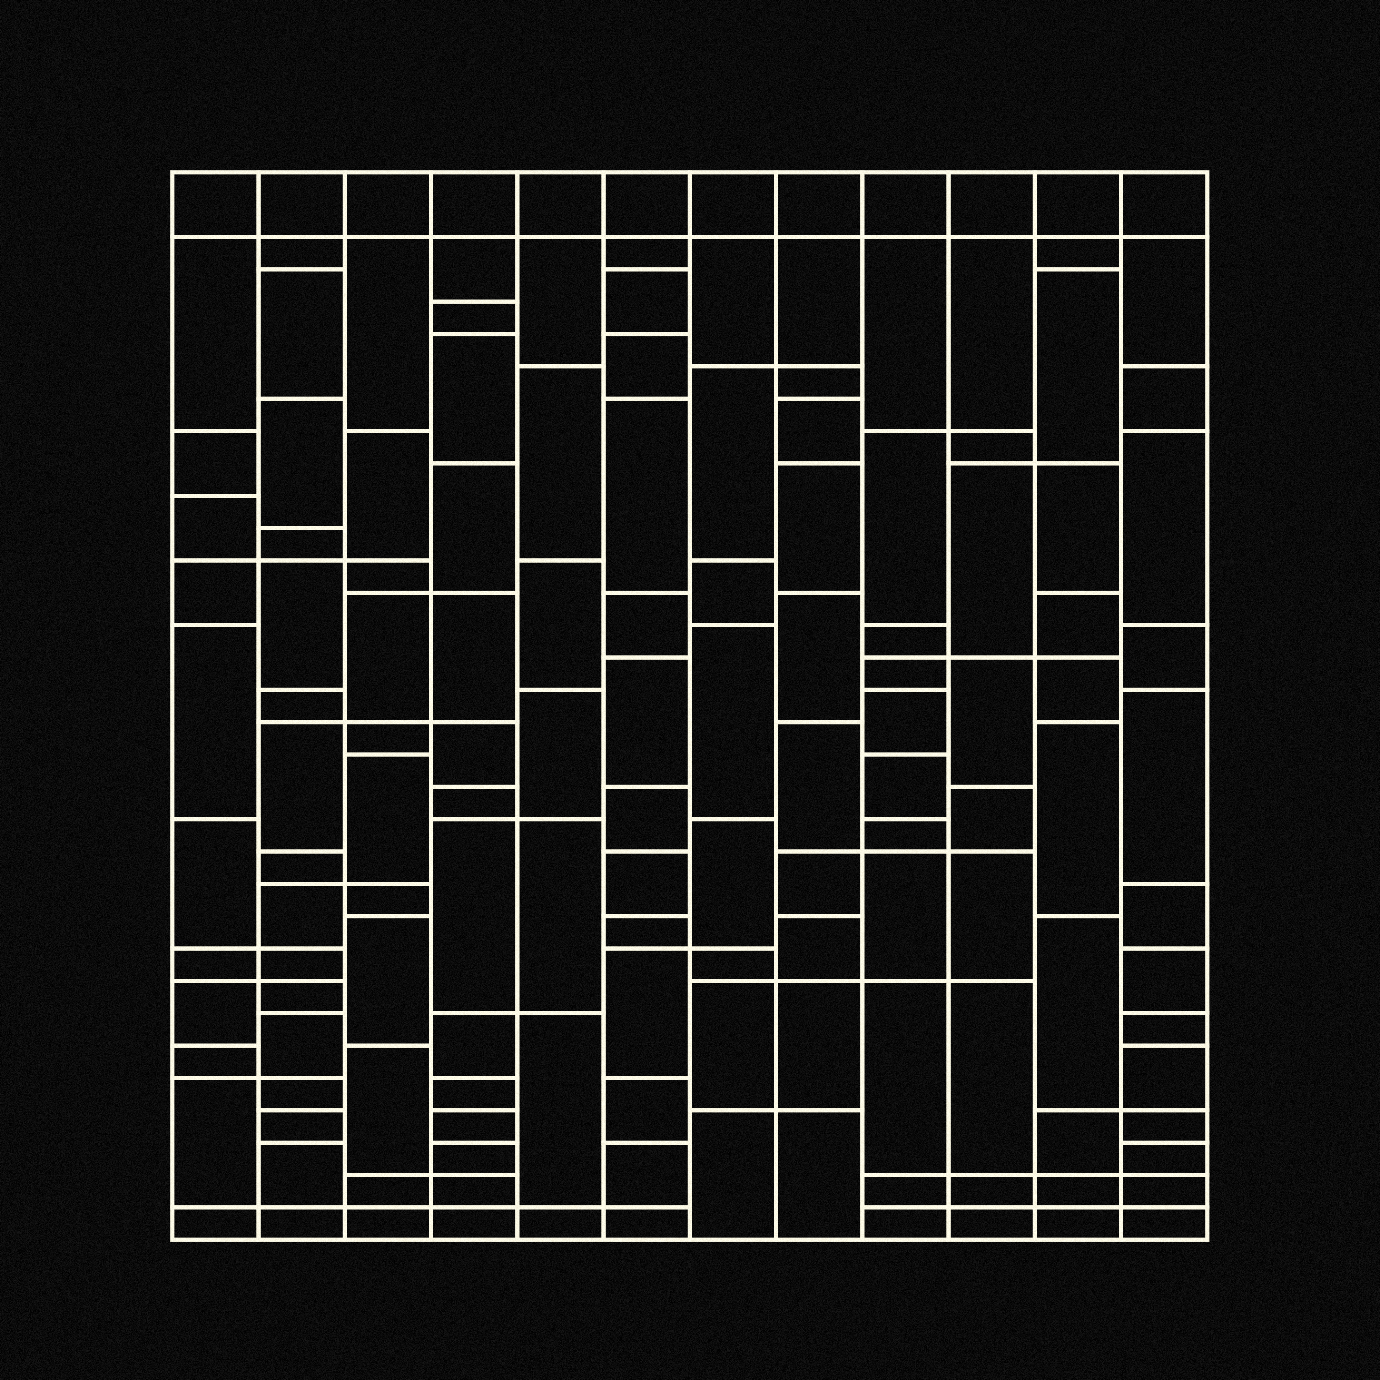
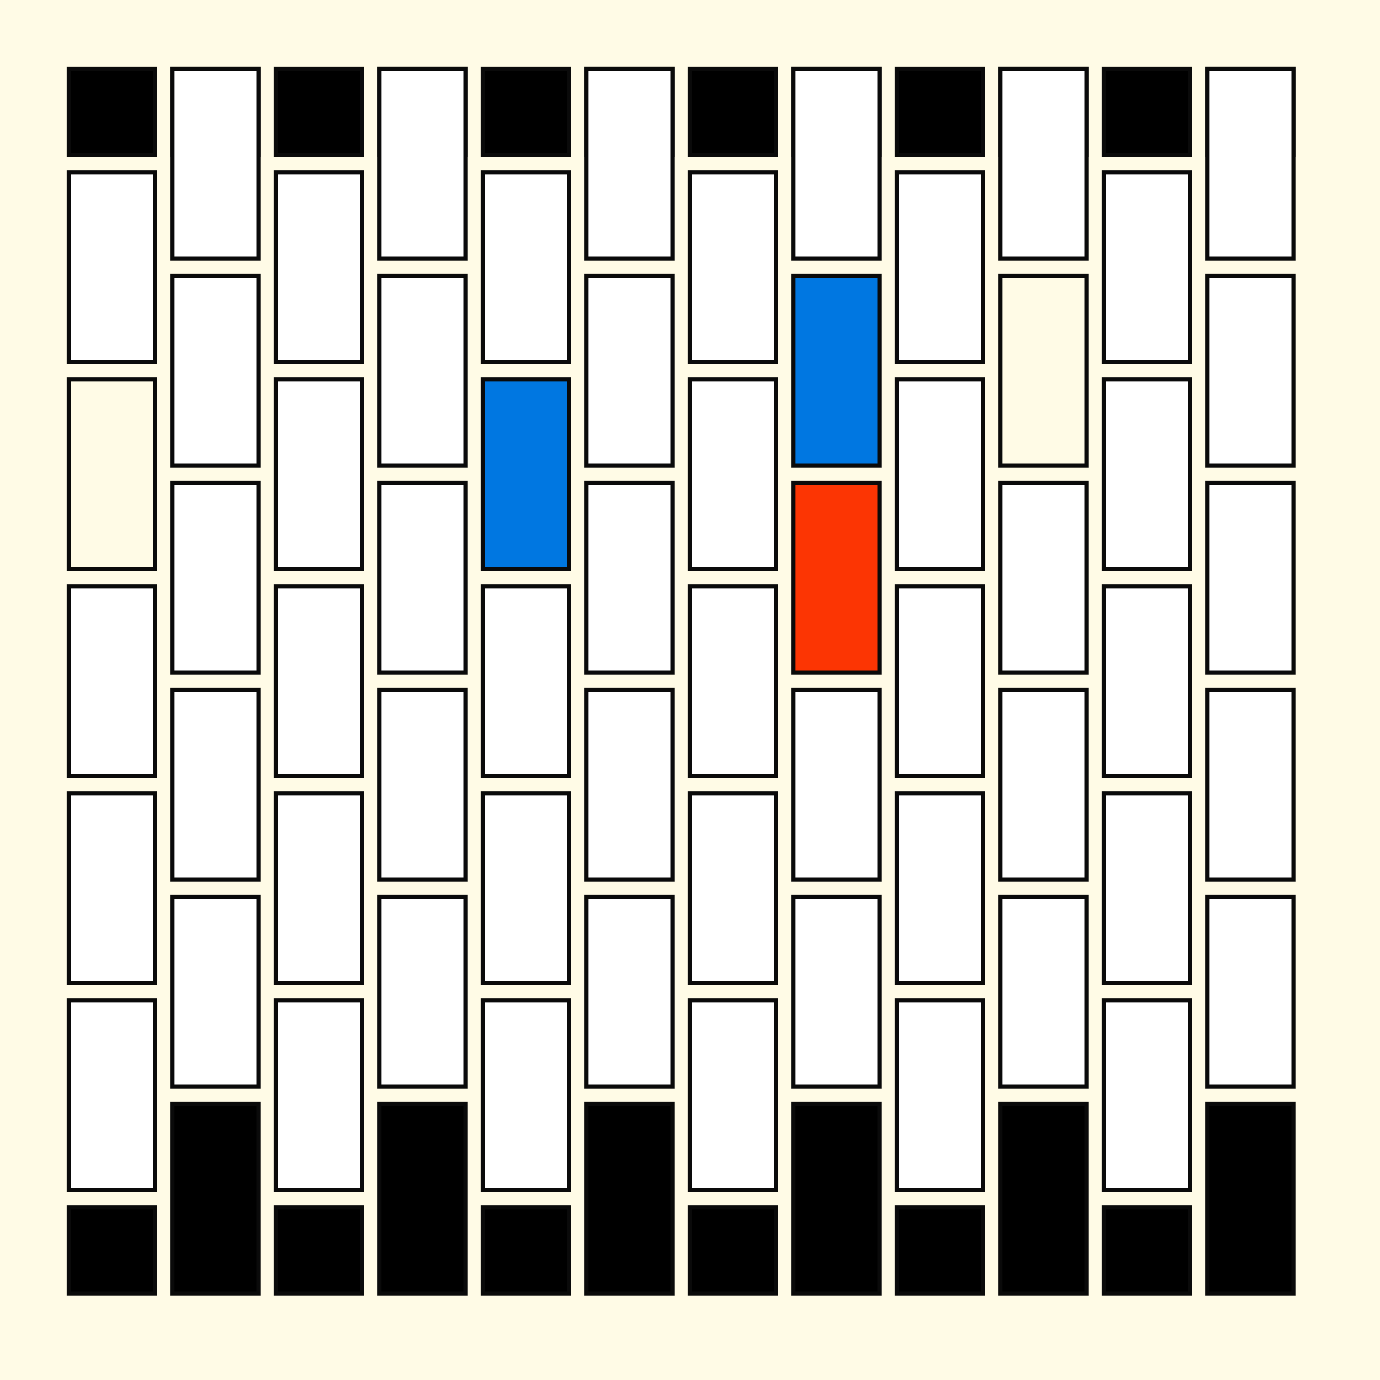
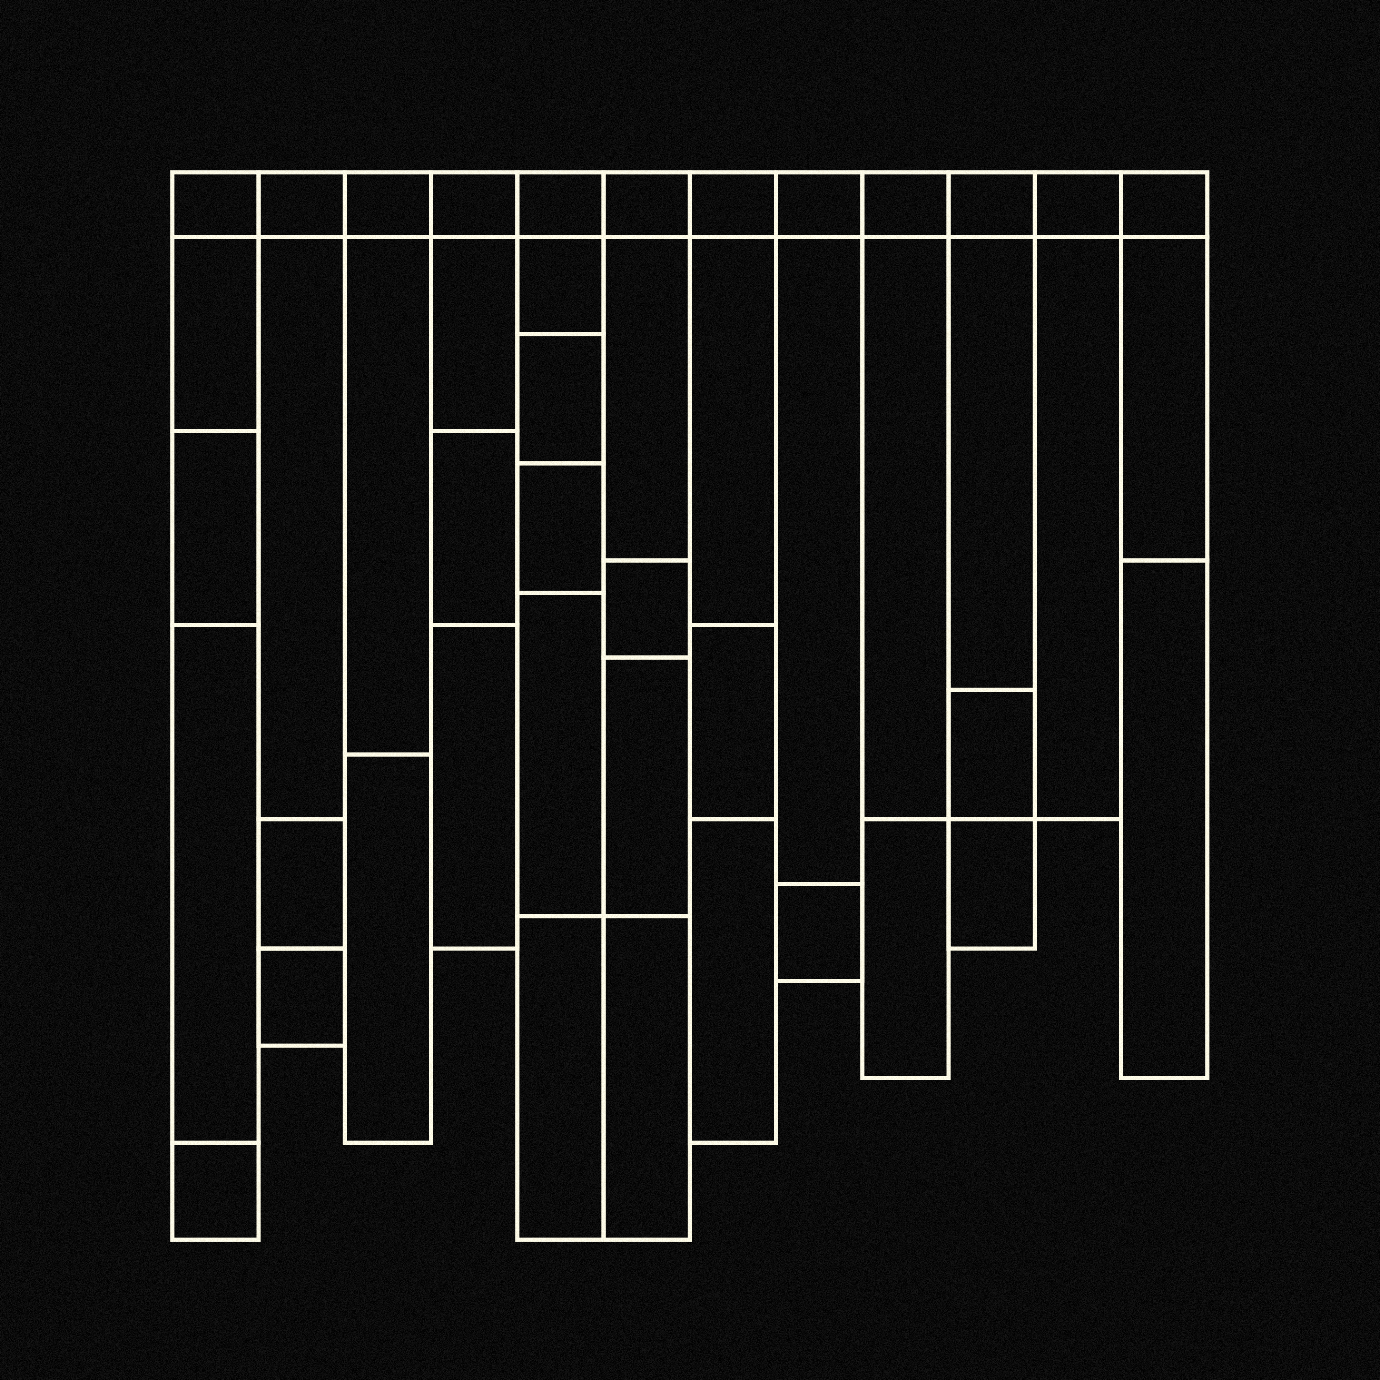
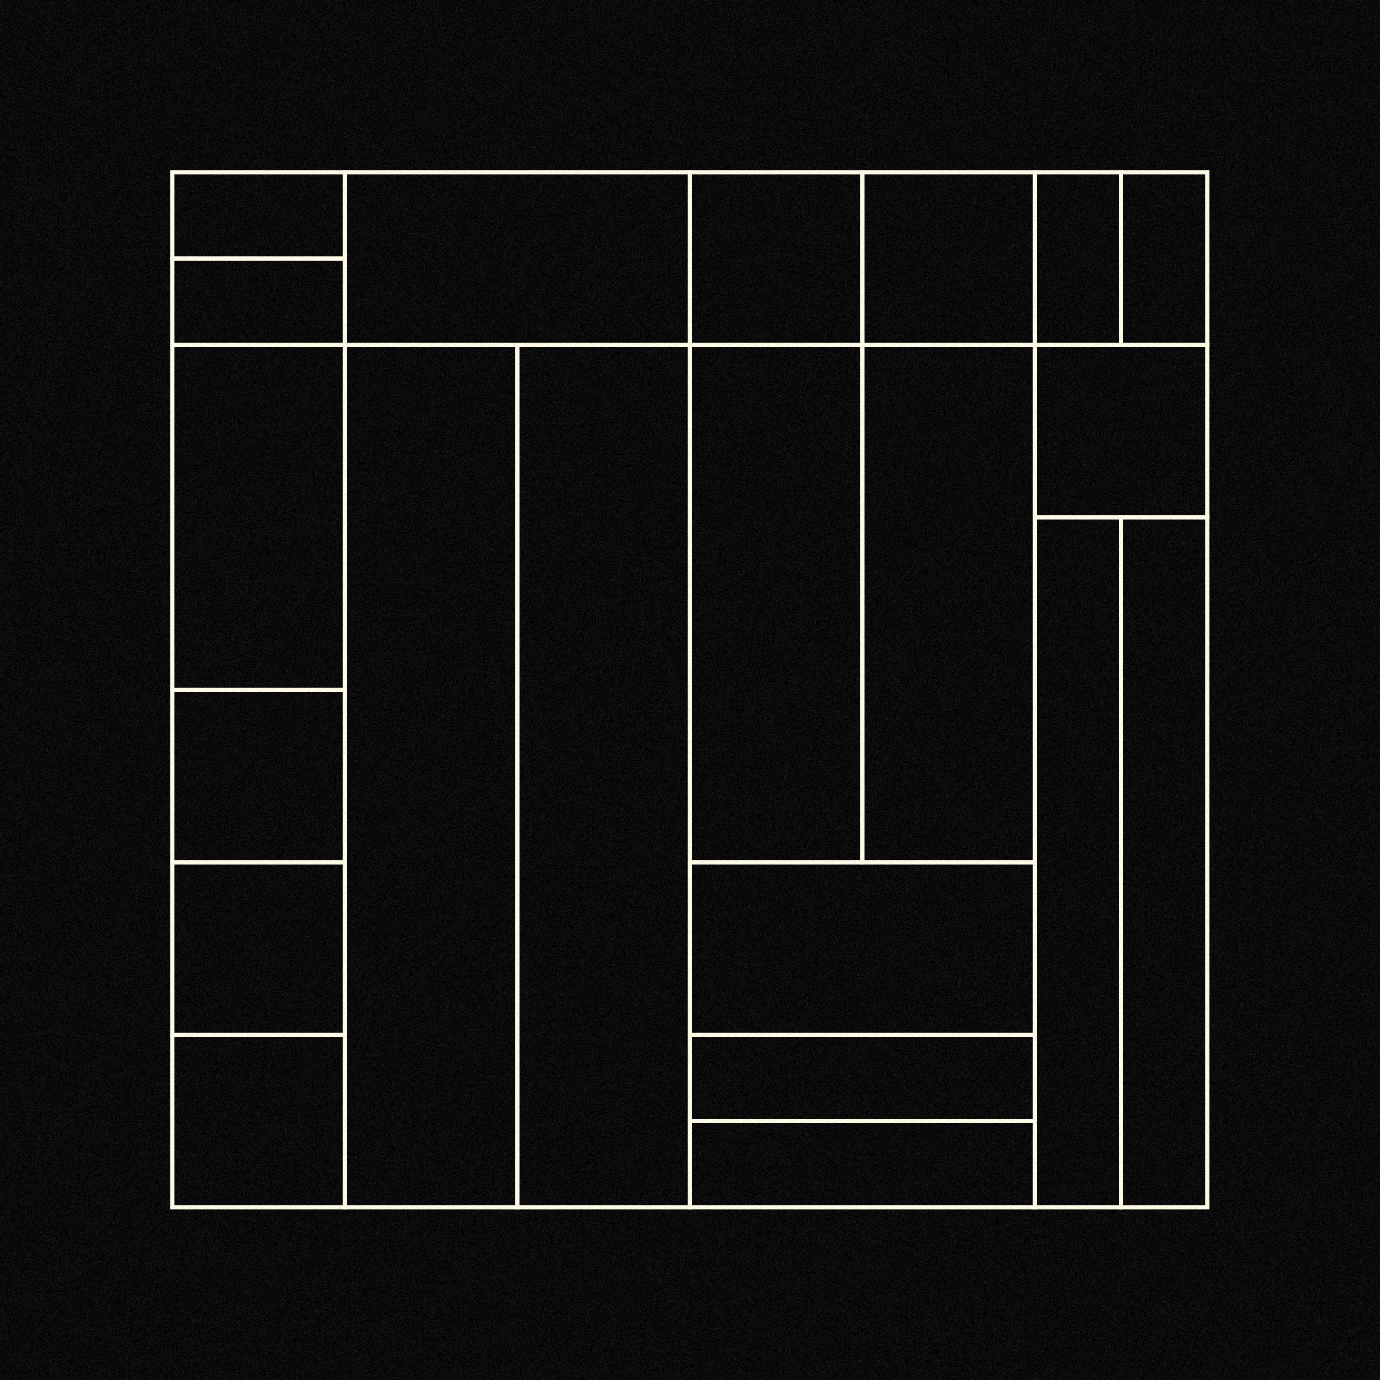
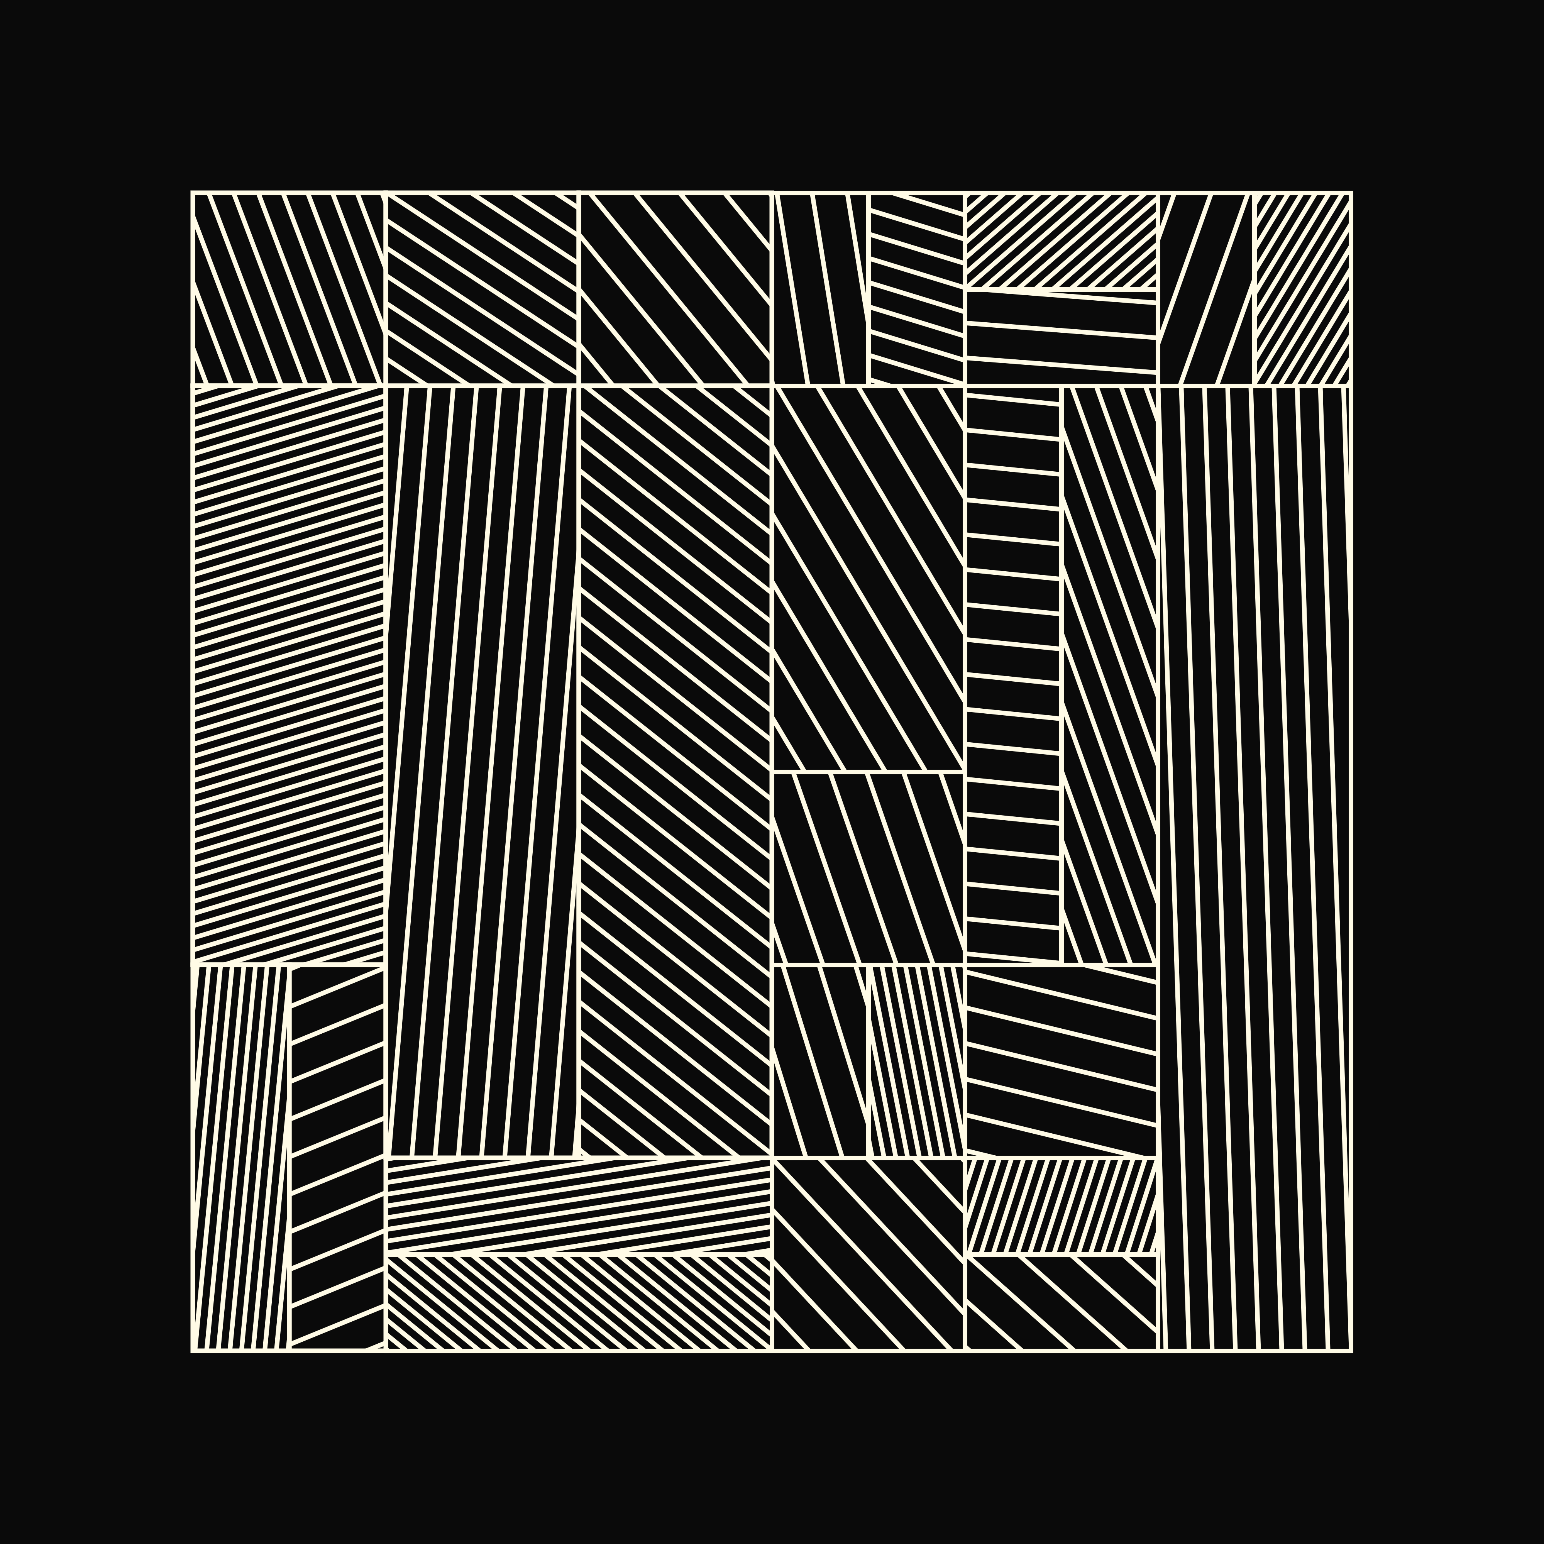
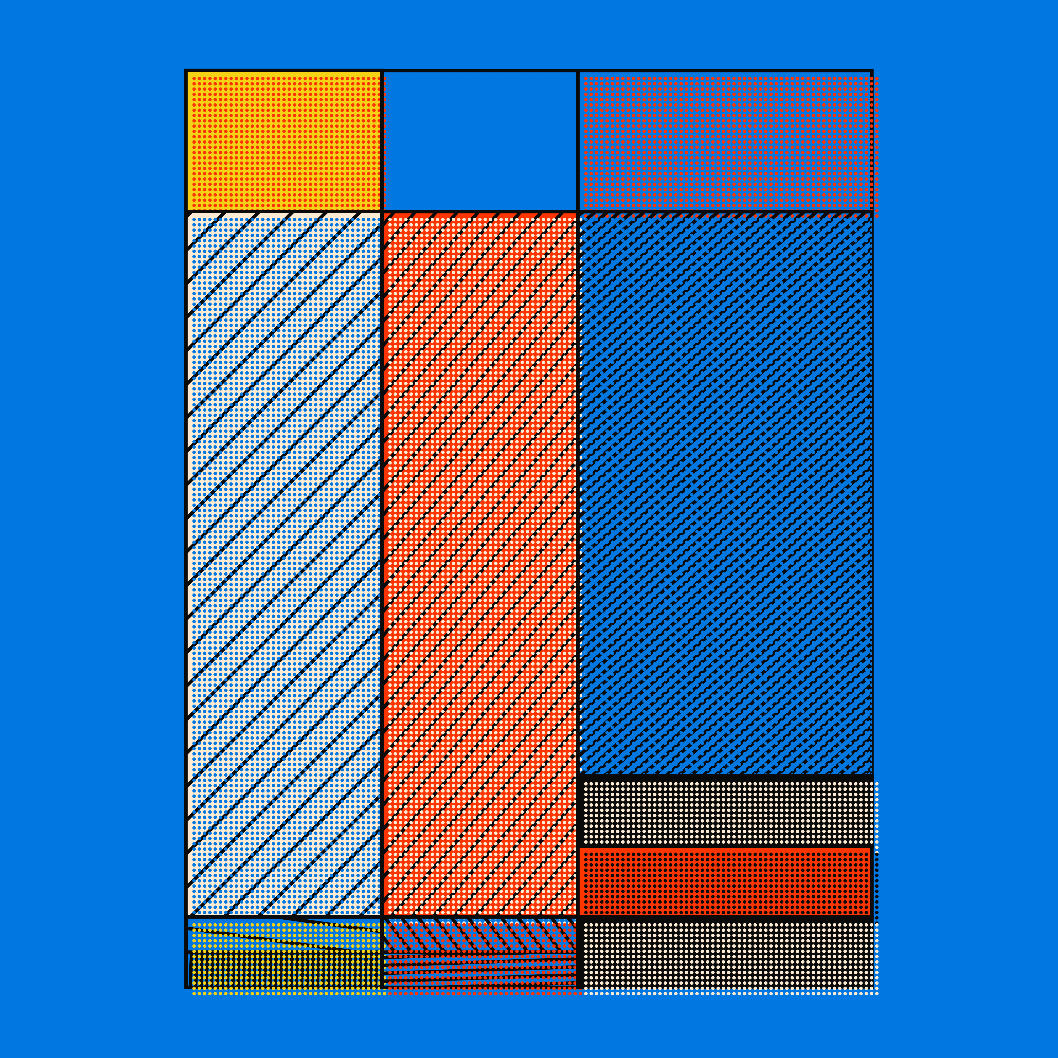
Now we can repeat the same idea for the outer loop, and we end up with a grid that looks as follows:
Aesthetically, I didn't mind that the first row and column were always of the same height and width. So I just kept that in, and later on it isn't actually that noticeable anyway.
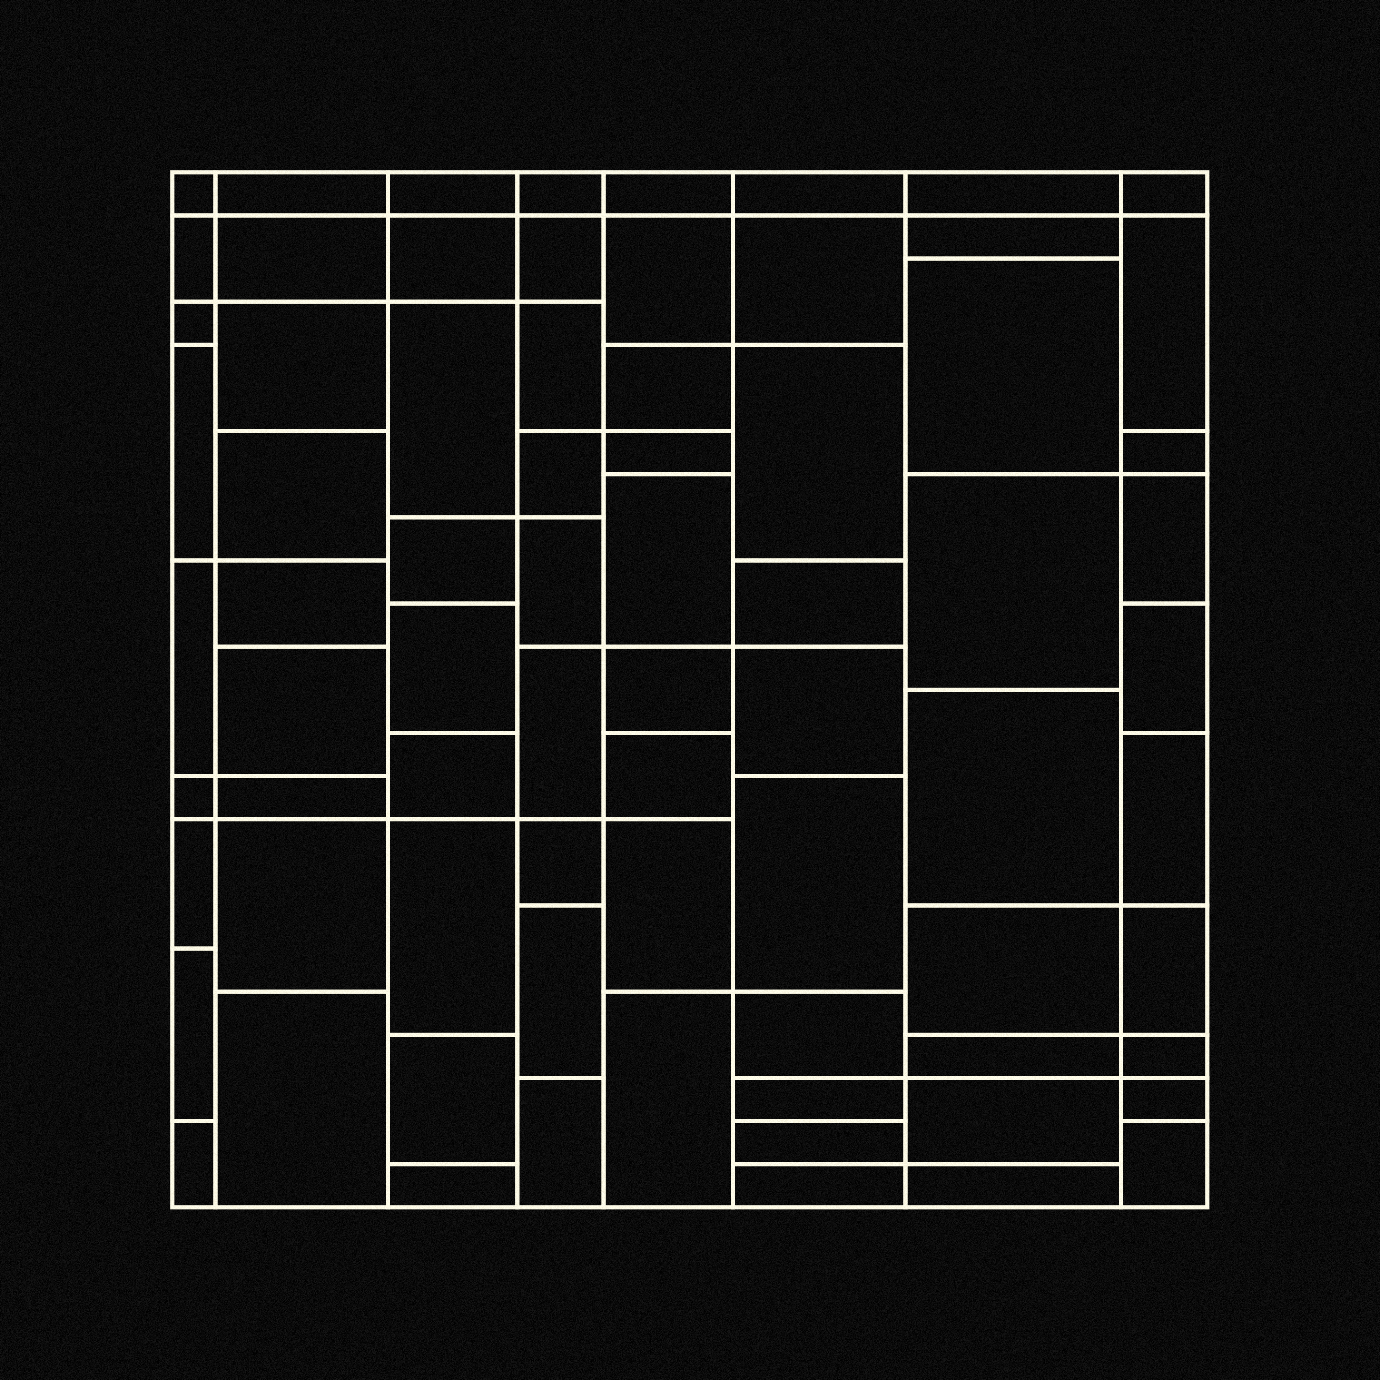
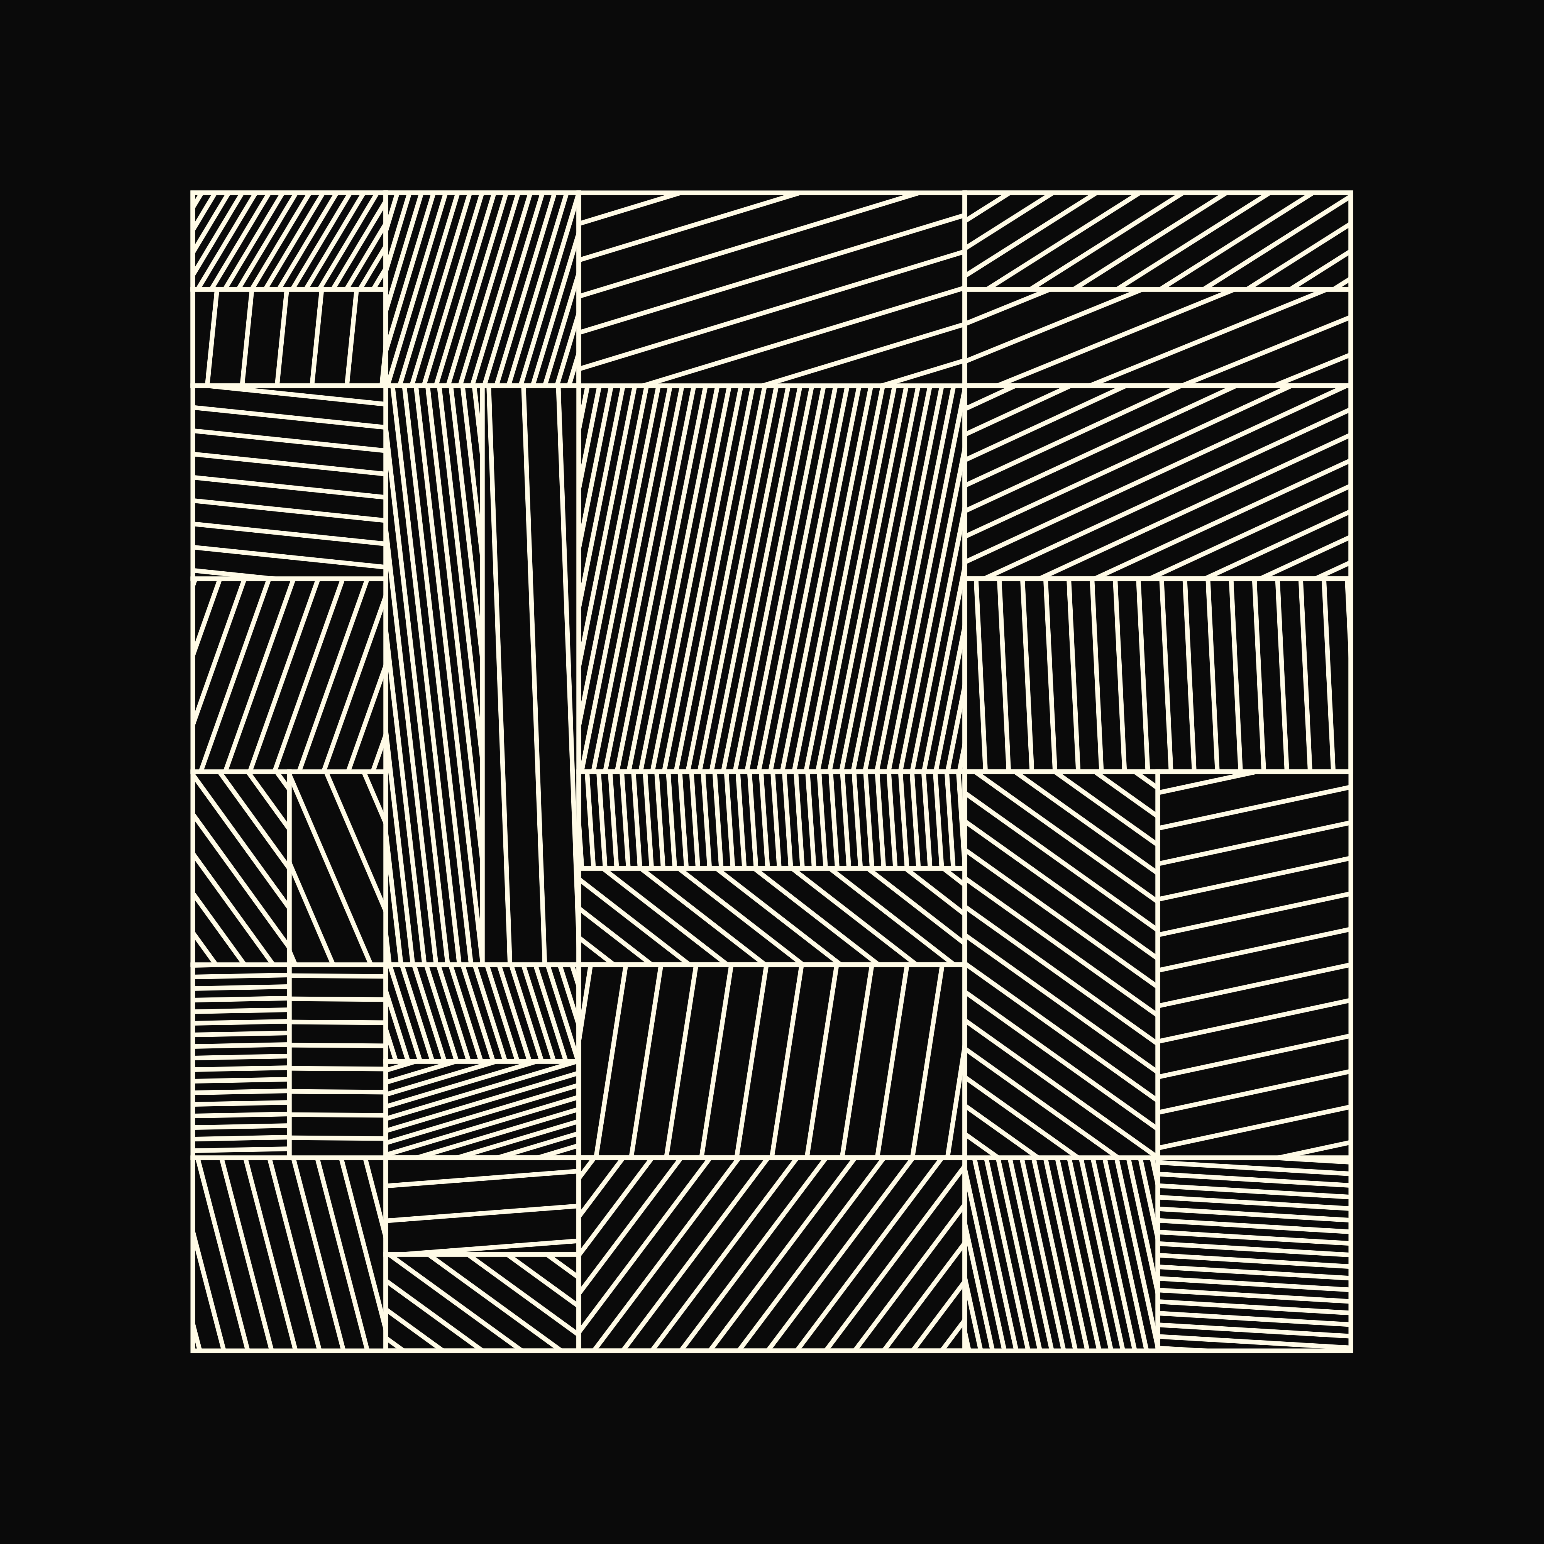
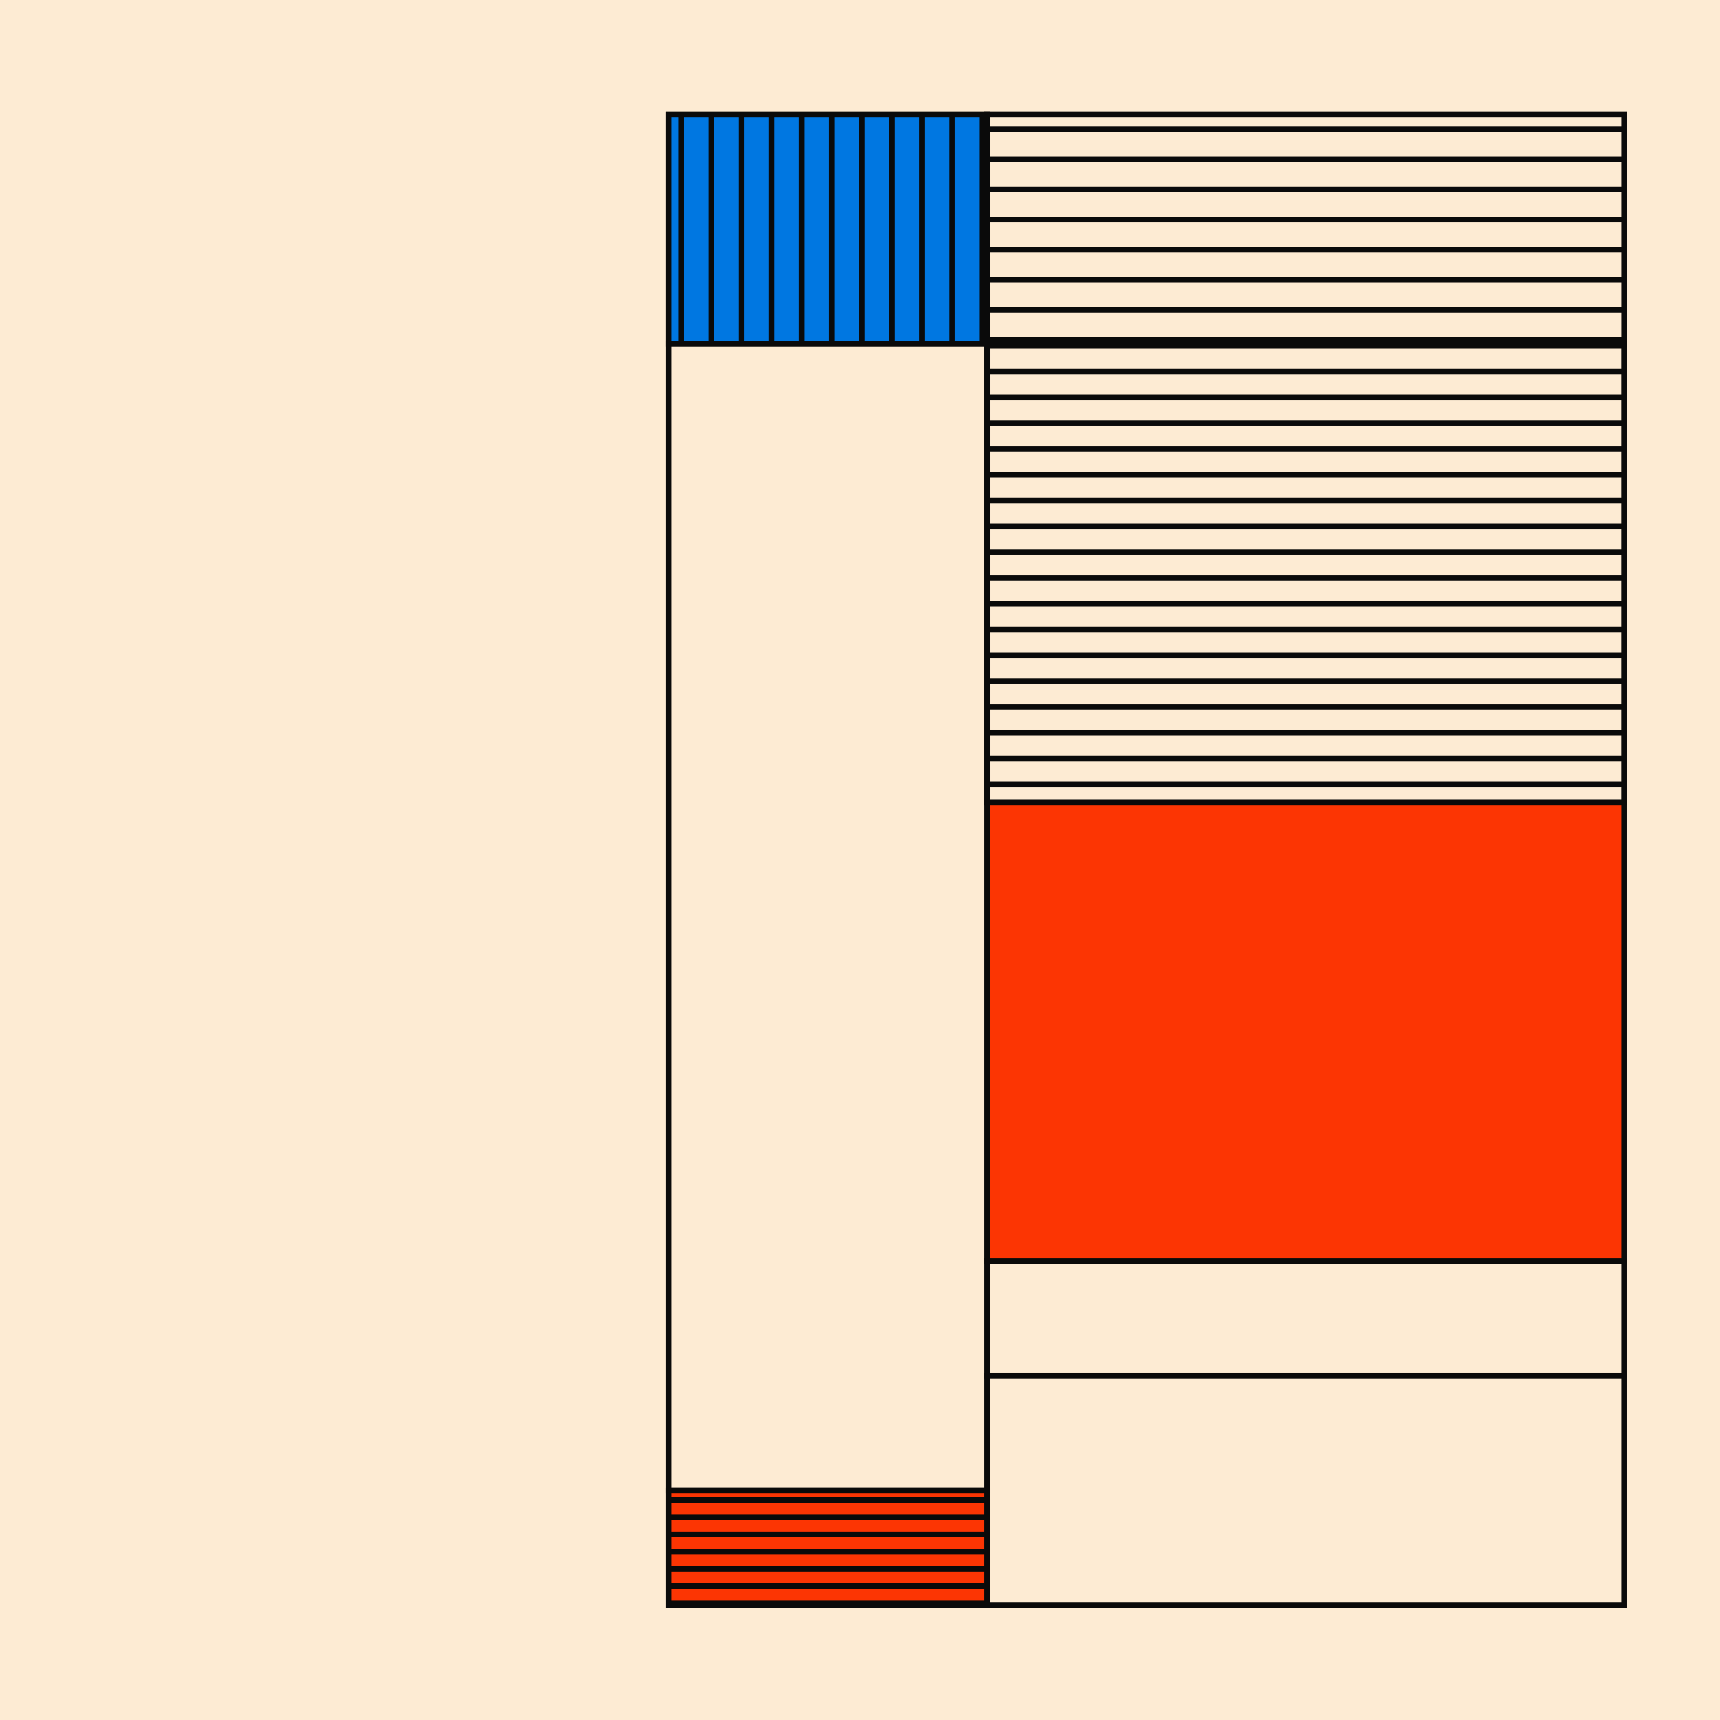
There's however one more thing that I did to make the pattern even more interesting. There's a random chance for the drawn rectangles to be split up vertically or horizontally into smaller rectangles.
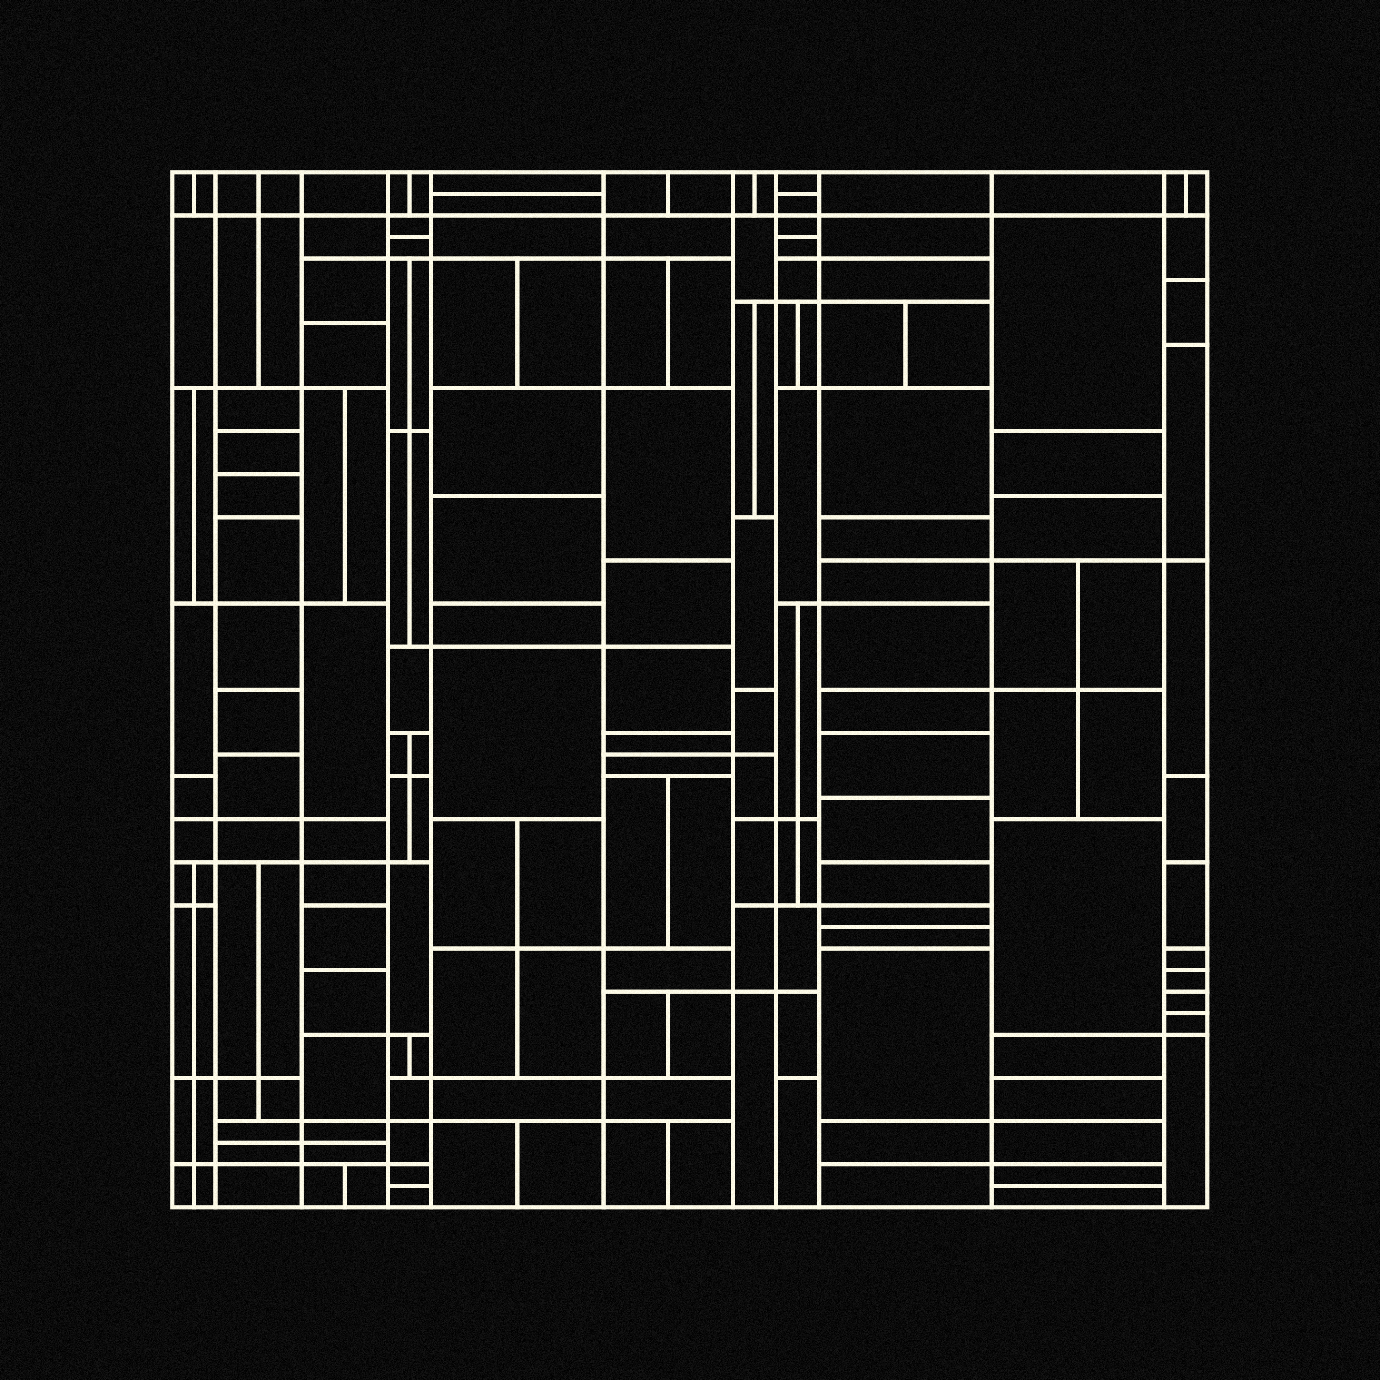
And that's pretty much all of the ingredients that went into the making of this particular type of grid. I encourage you to experiment with something like this if you want to spice up your grids, there's still many things that I could have modified to add additional variety. But this seemed like an adequate system for potentially 100 iterations.
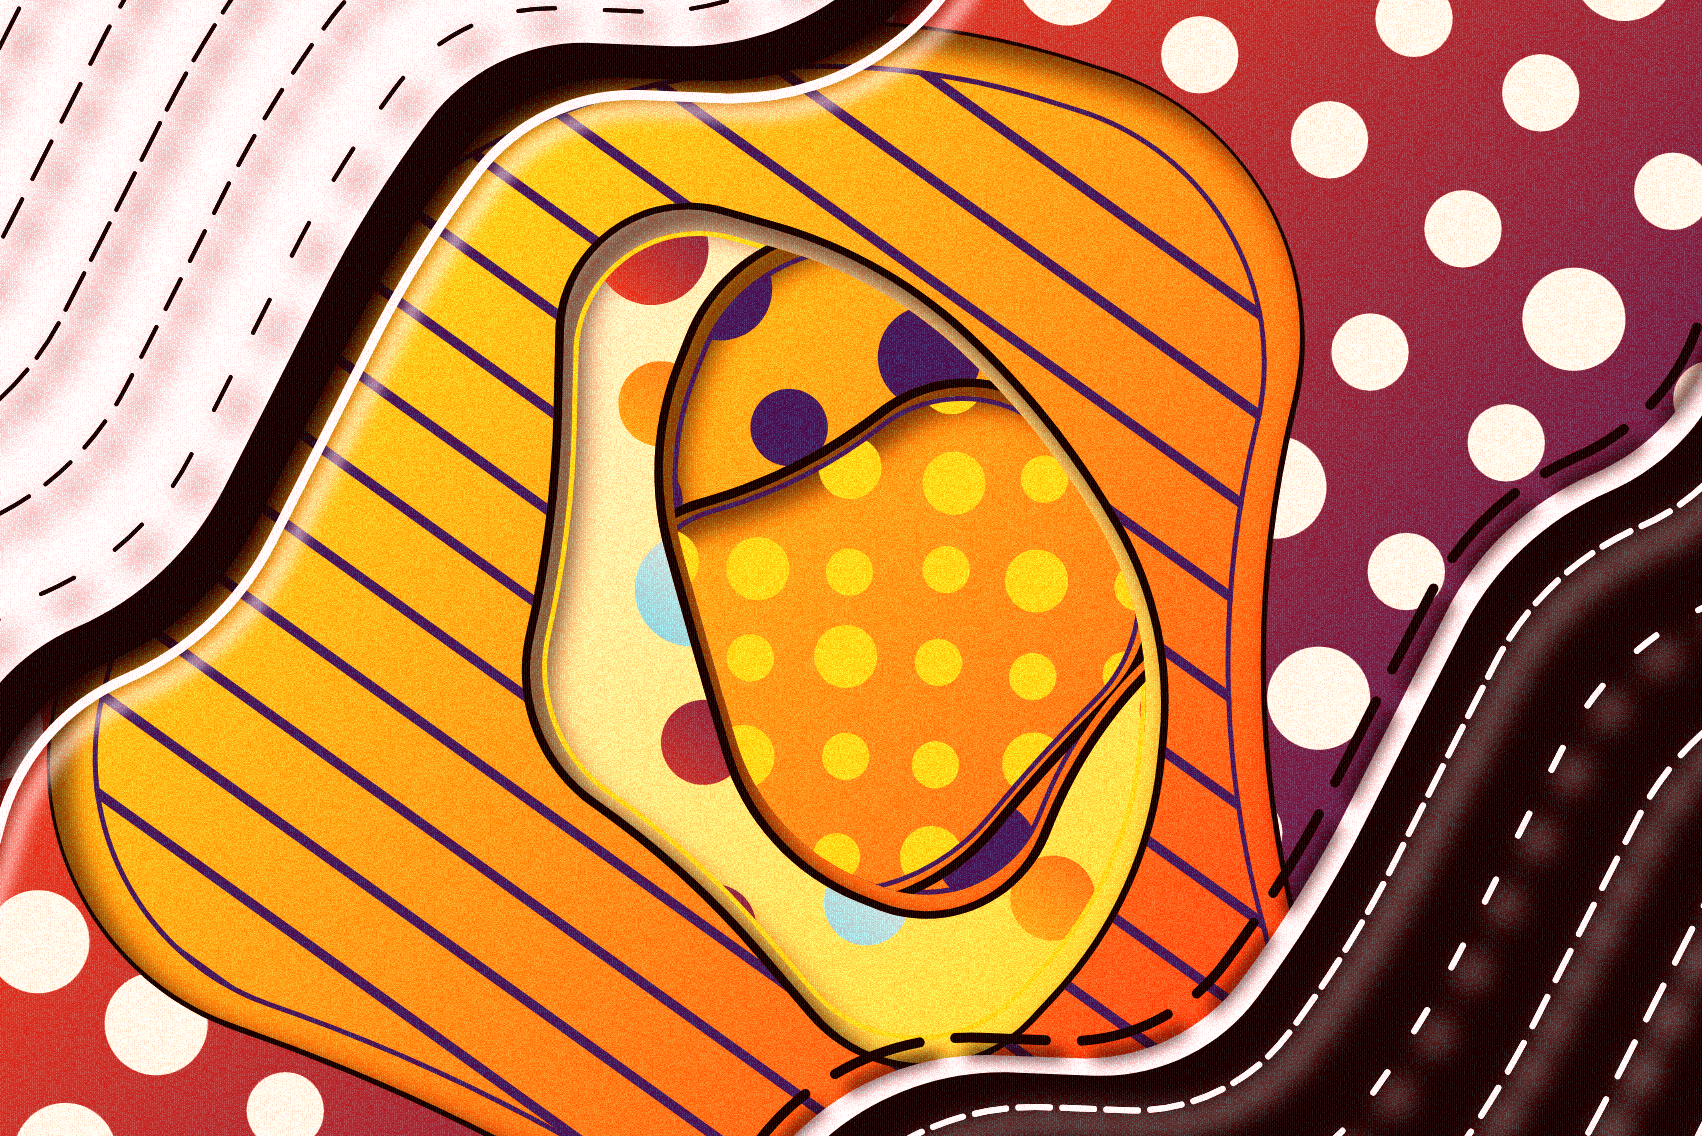
Hachure Lines
I absolutely love hachures. Probably better to refer to them as hatch lines in this case. They instantly give things a more 3 dimensional aesthetic, depending on their orientation and the density of the lines.
Restricting the hatch lines to the rectangles' boundaries can be done with the rendering context's clip() method. Which is most likely one of my favourite tricks. I discovered the method when I created my token for crayon codes February of last year (2022), and wrote about it a bit more here. Crayon codes, ahead of it's time, as the first platform to implement a co-creation mechanism, it just felt right to come back to this clipping idea.
Essentially, when invoking the clip() method after drawing a shape, either with rendering context functions, or any of the shape functions in p5 (which make use of the rendering context under the hood anyway), whatever follows the clip() function will be restricted and clipped to that shape.
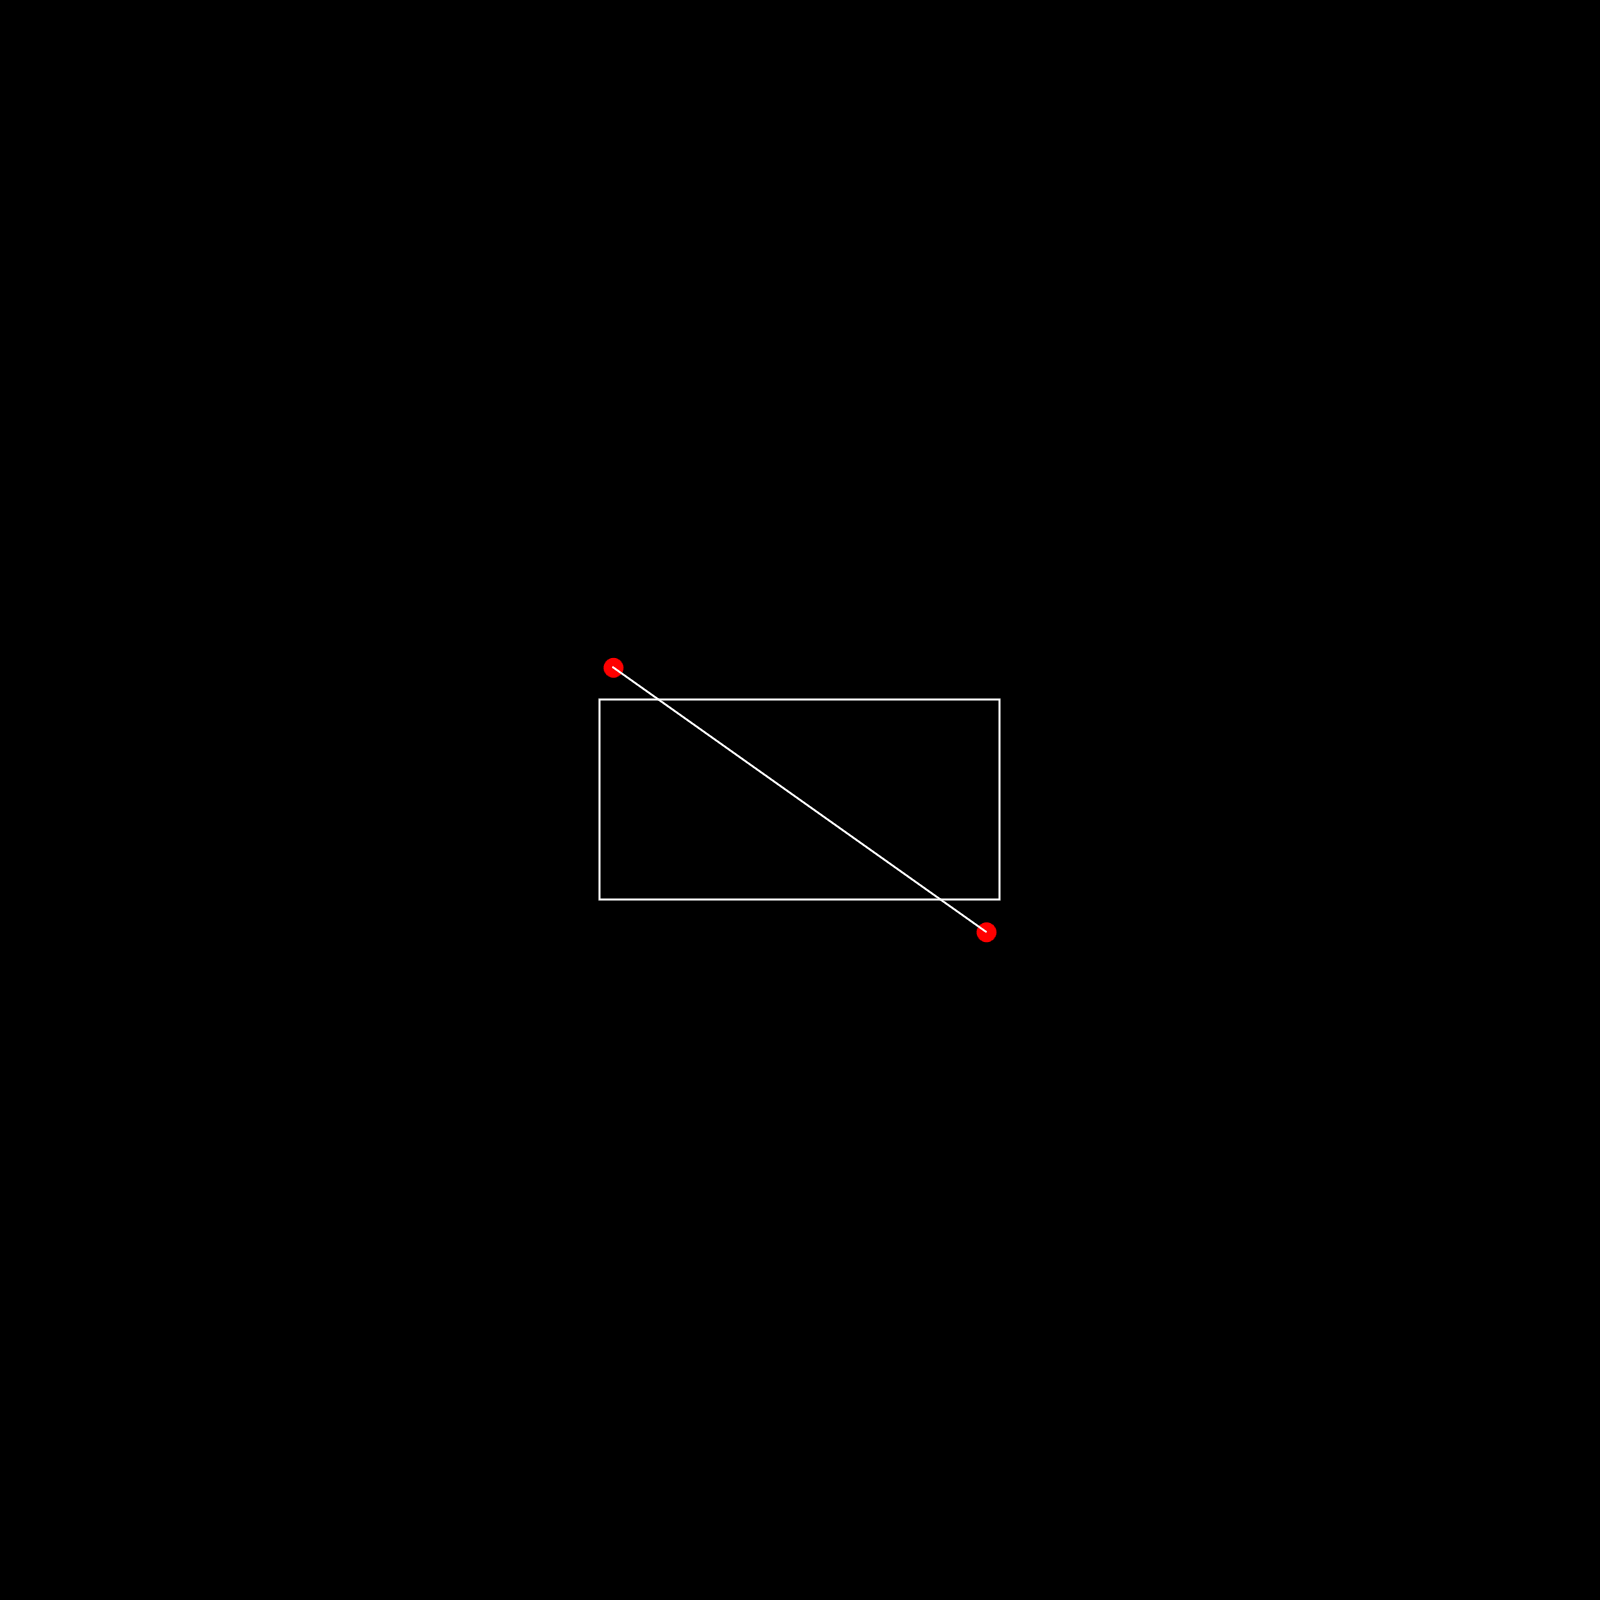
This means that we just need to draw some hachure lines to the canvas and have them occupy space on the canvas underneath the respective rectangle. The function that draws the hachure lines functions as follows:
- Select an angle, randomly or from an array of quantized angular values (depending on the angle mode)
- Compute the diagonal length of the rectangle. If the selected angle is coincidentally the same as the digonal's slant, then the hachure lines need to be at least that long to span the entire rectangle.
- Select a distancing value at random, this variable will determine how close the hachure lines are to each other.
- With trigonometry, compute the coordinates of the two points that form the extremeties of the line that has a slant and length equal to the values that we computed in step 1 and 2. In less complicated terms, we basically draw a slanted line, that has a slant equal to the angle we selected in step 1, and a length equal to the diagonal length of the rectangle.
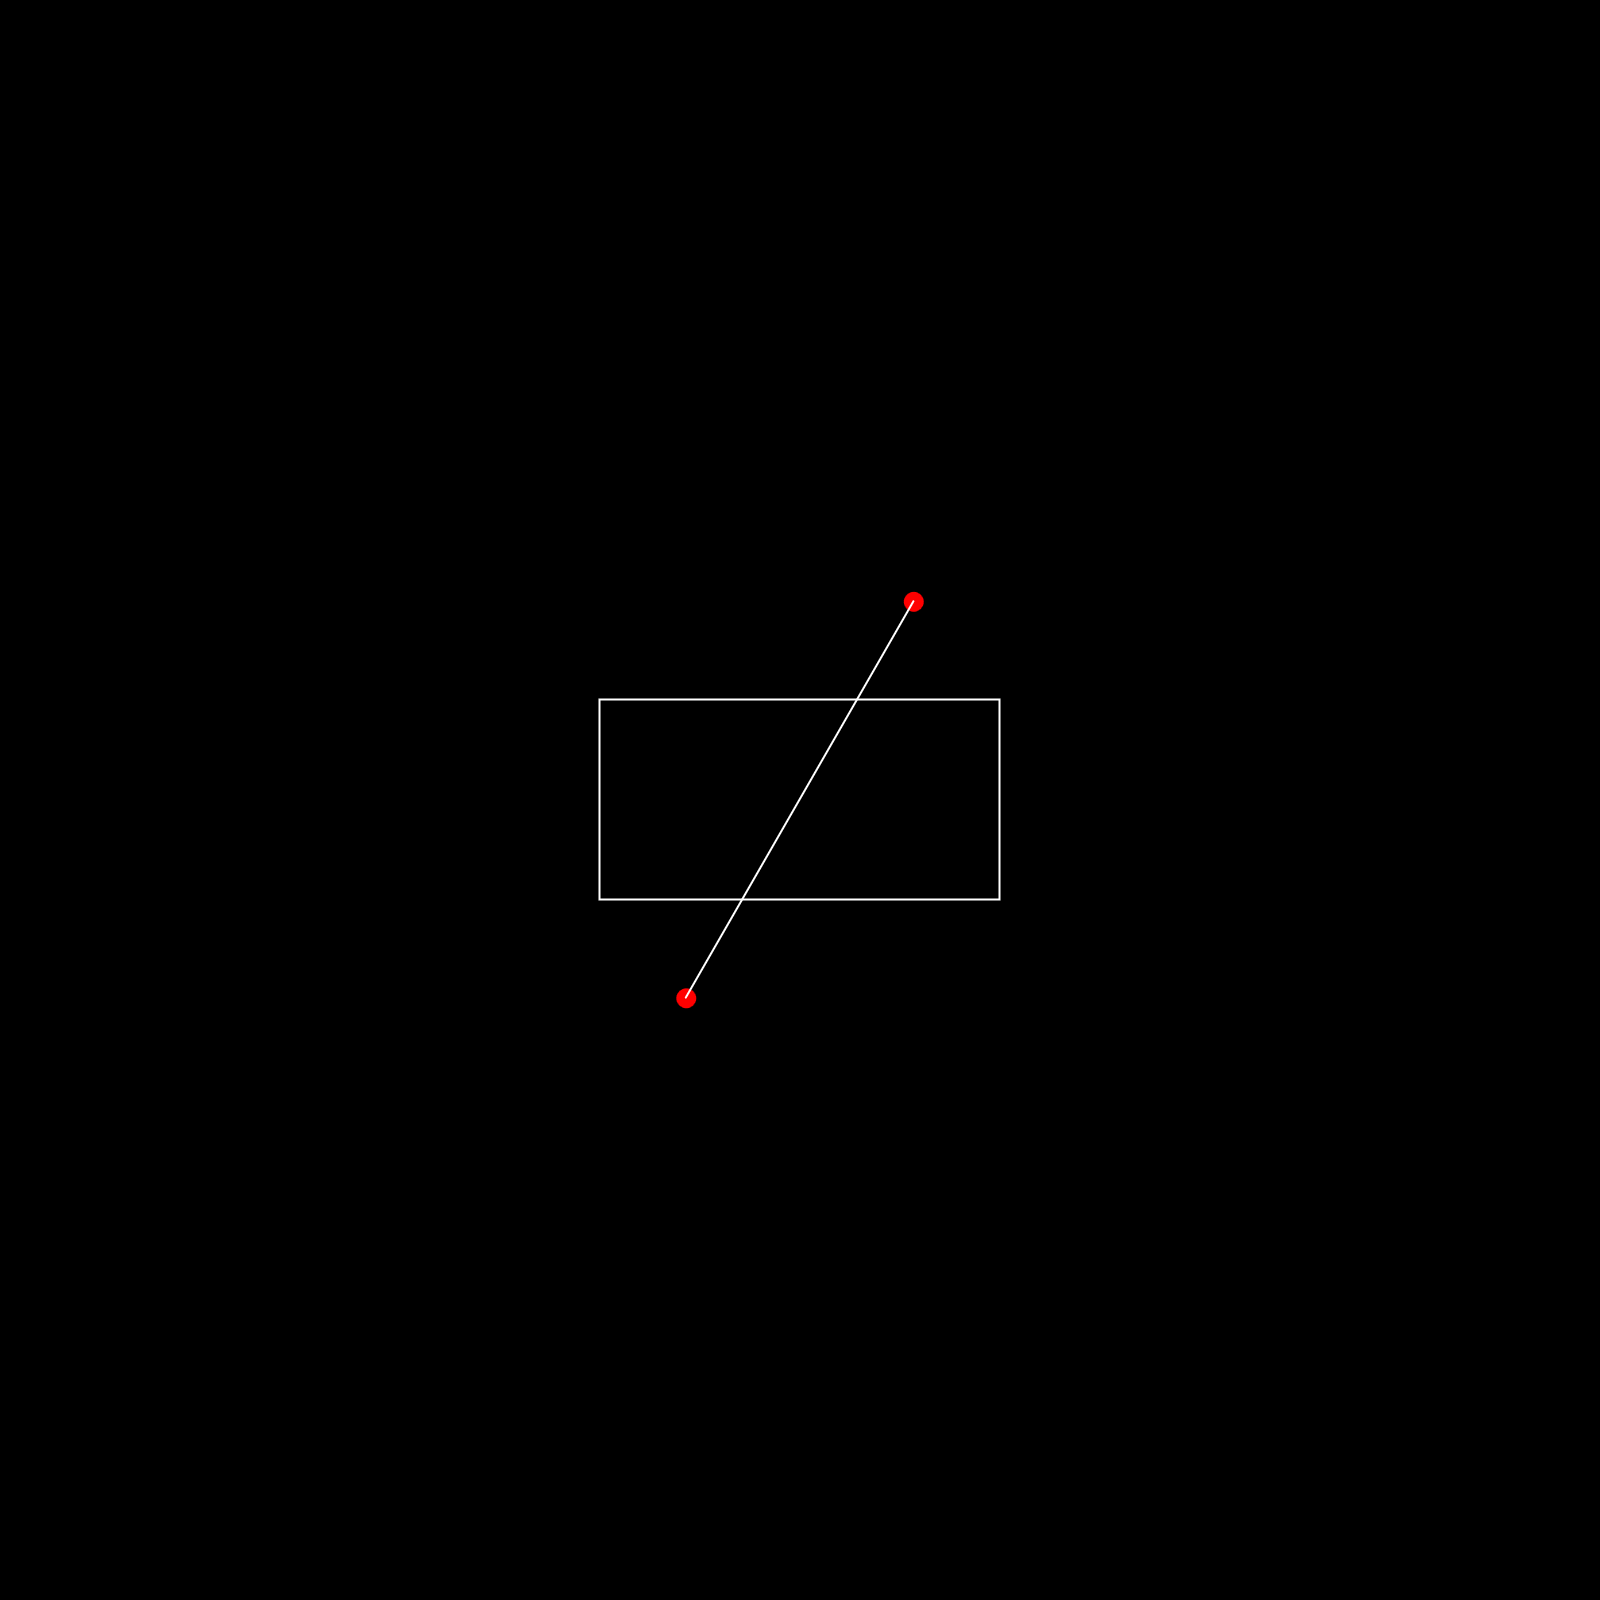
- With linear interpolation we step from one of the two extremities towards the other (with a distance equal to the distancing value we selected in step 3), drawing a perpendicular at each step.
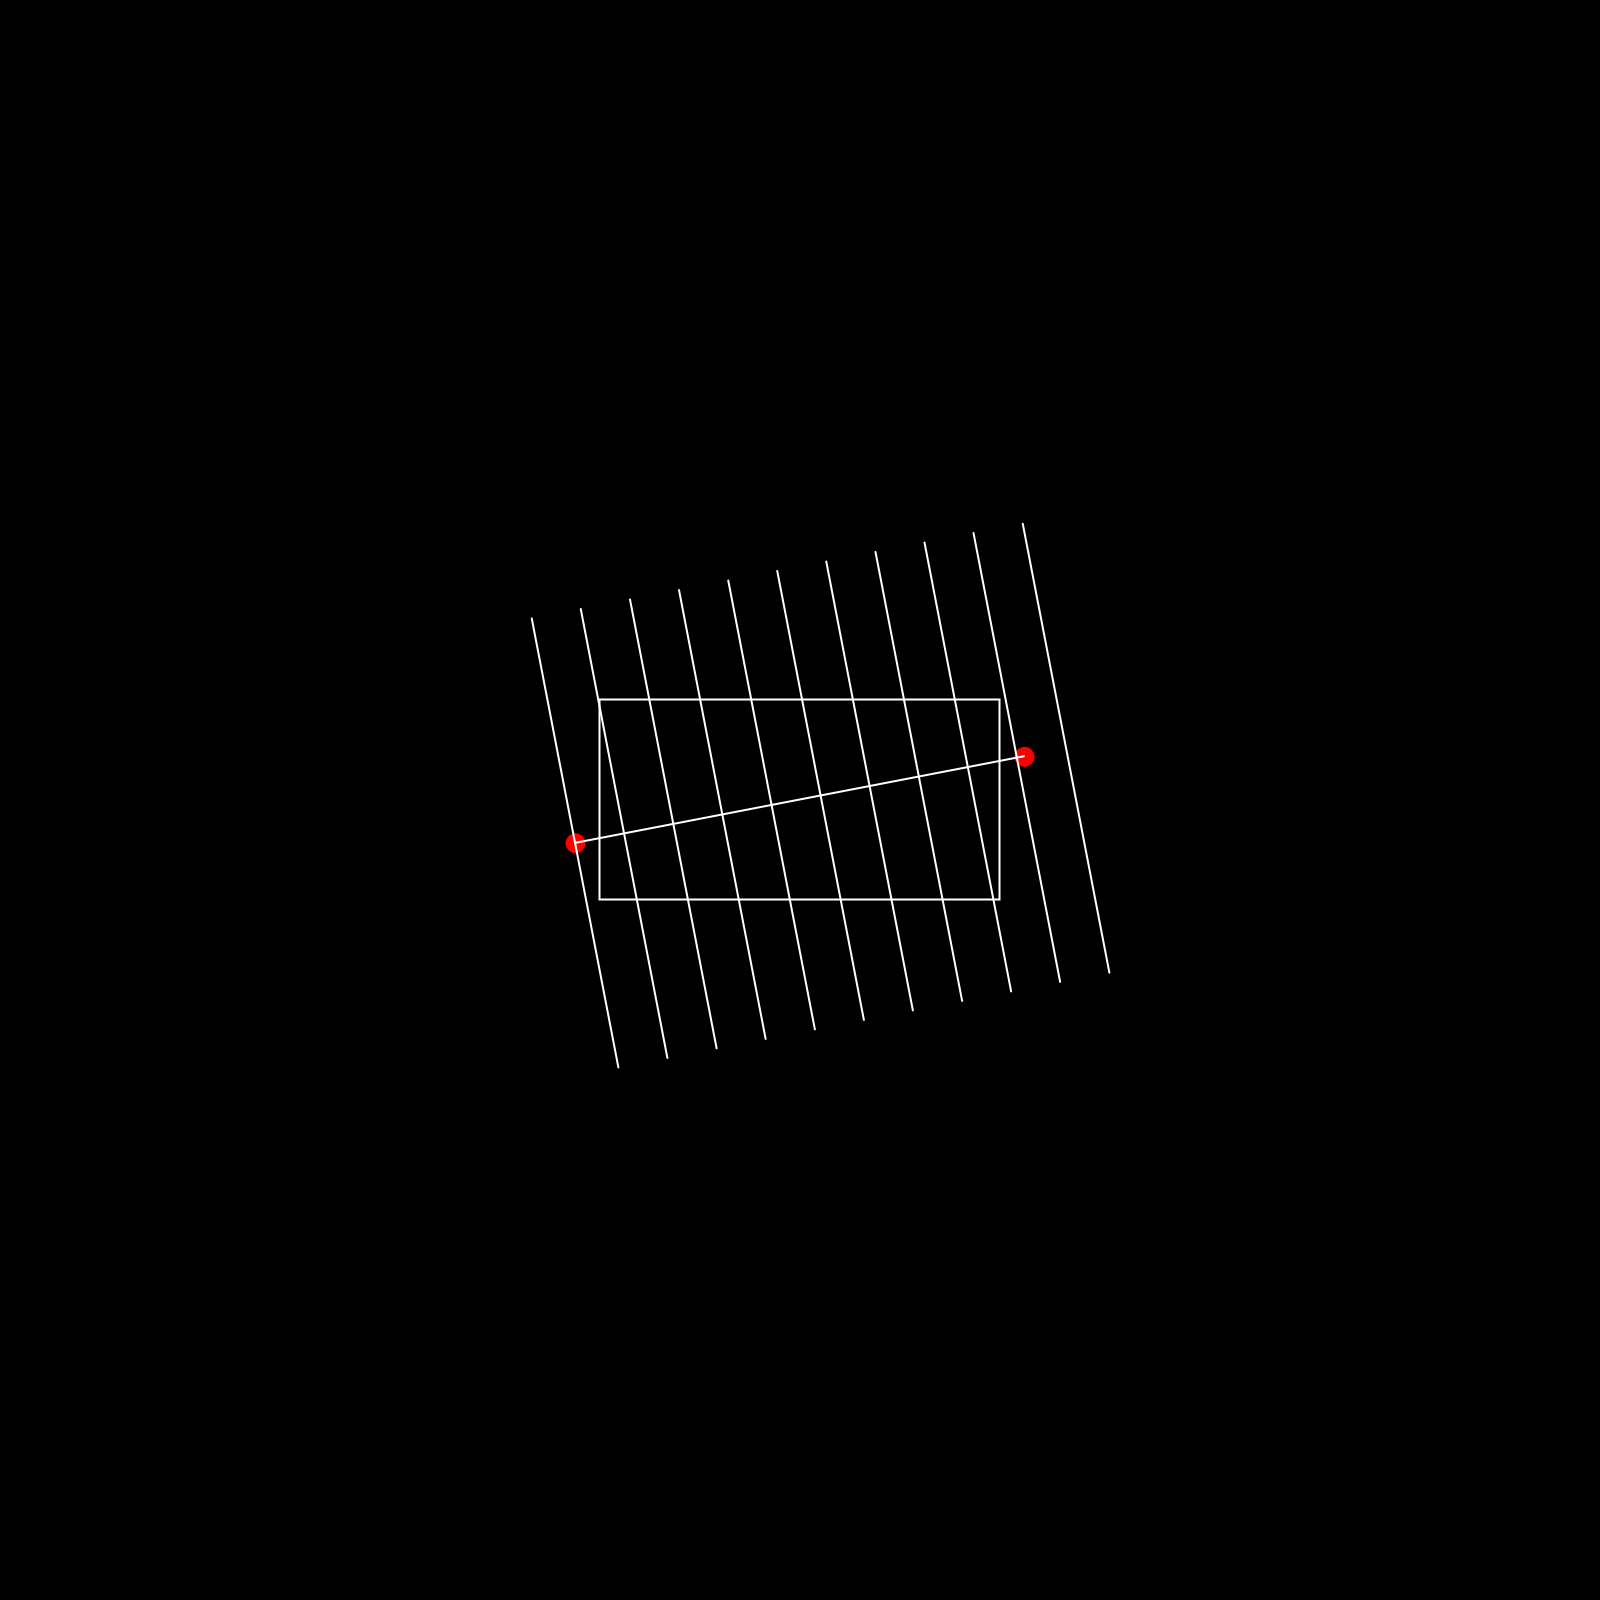
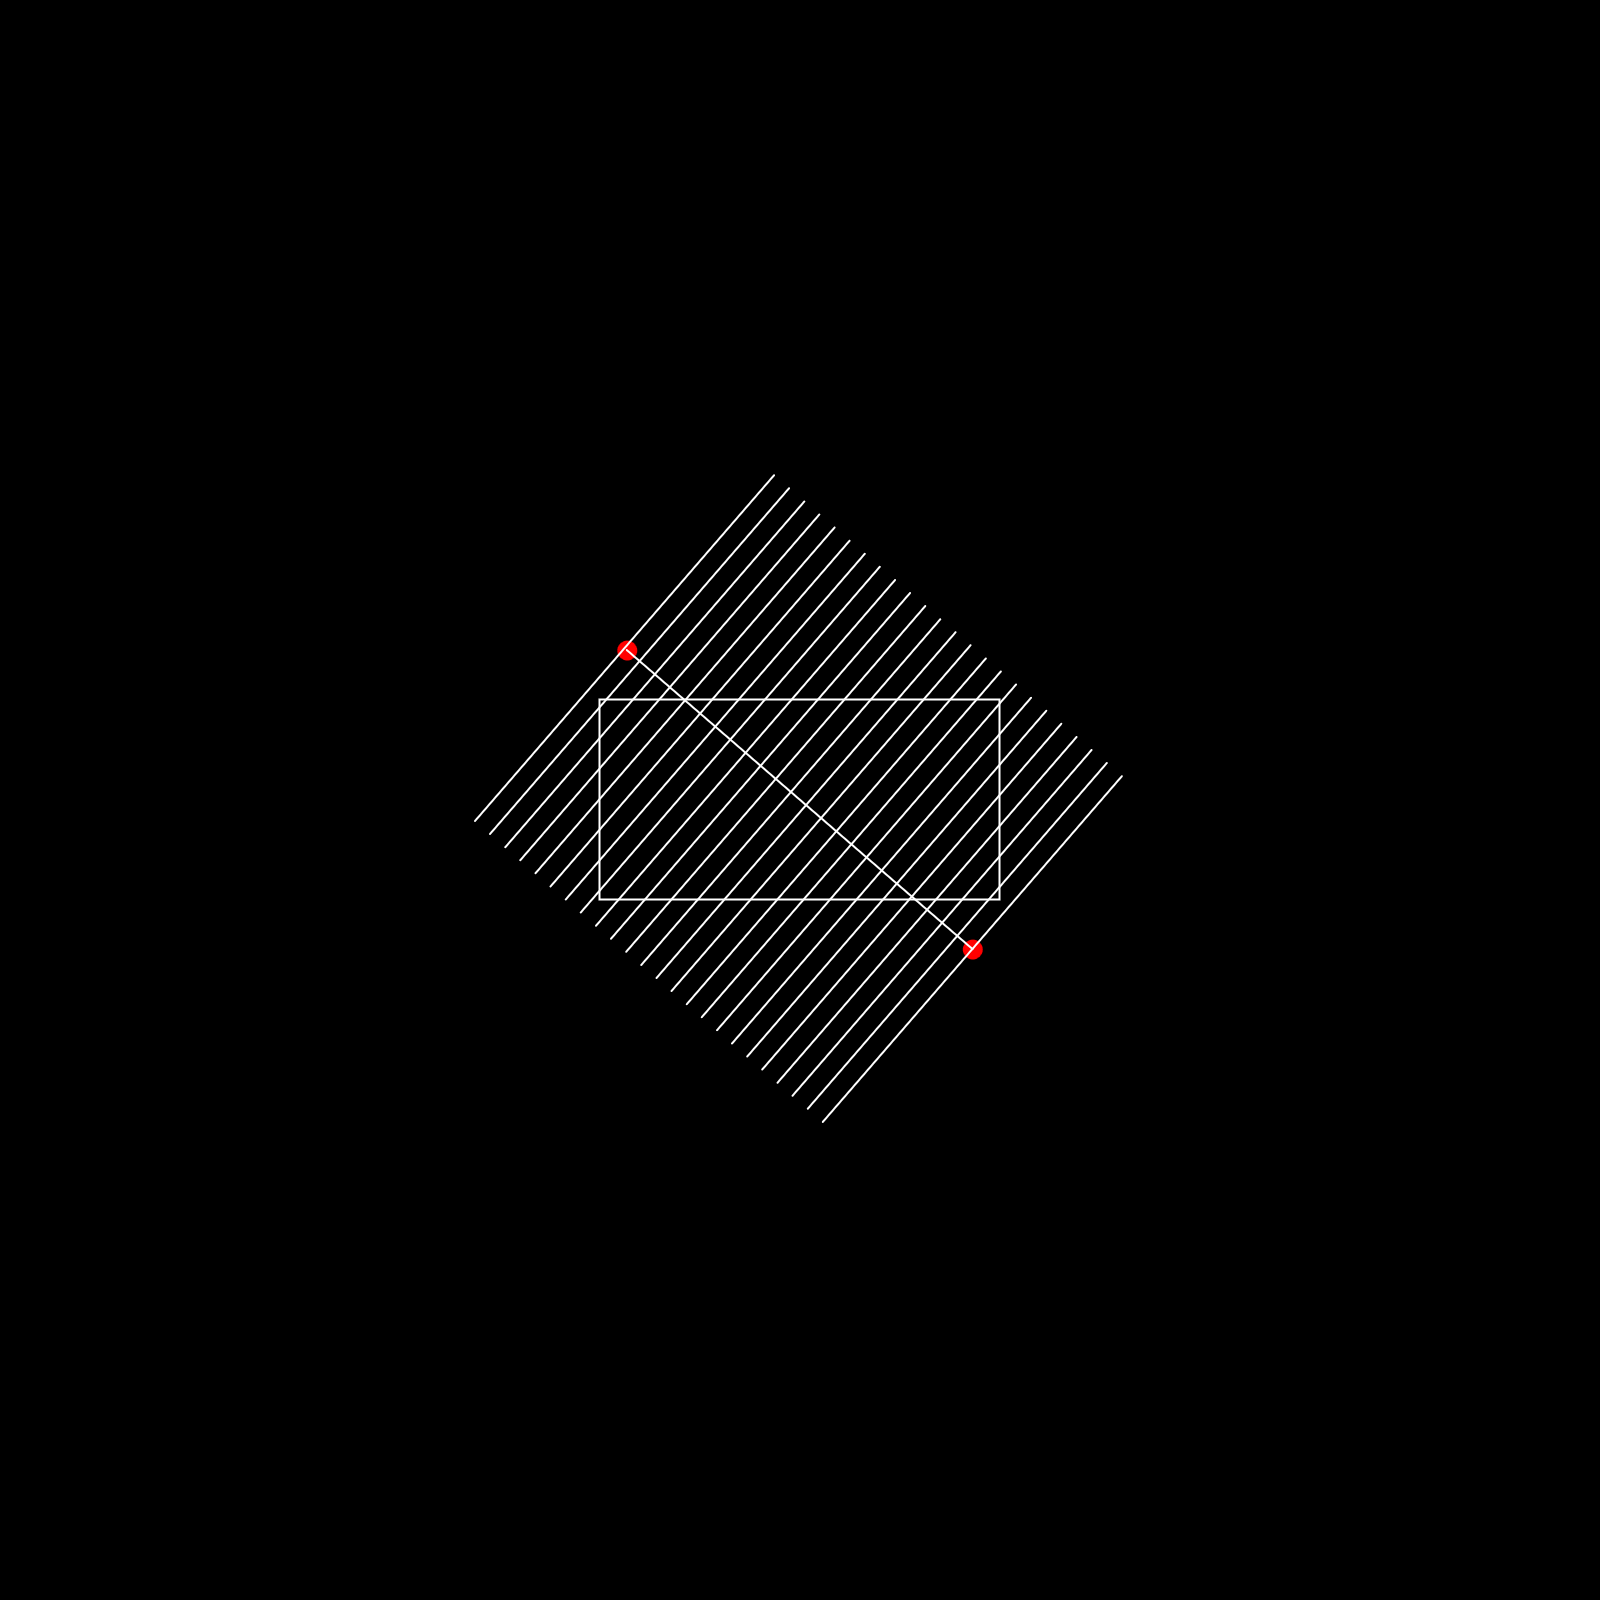
- Finally we clip this pattern to the previously drawn rectangle.
I will probably make a more detailed breakdown of this hachur-ing code soon.
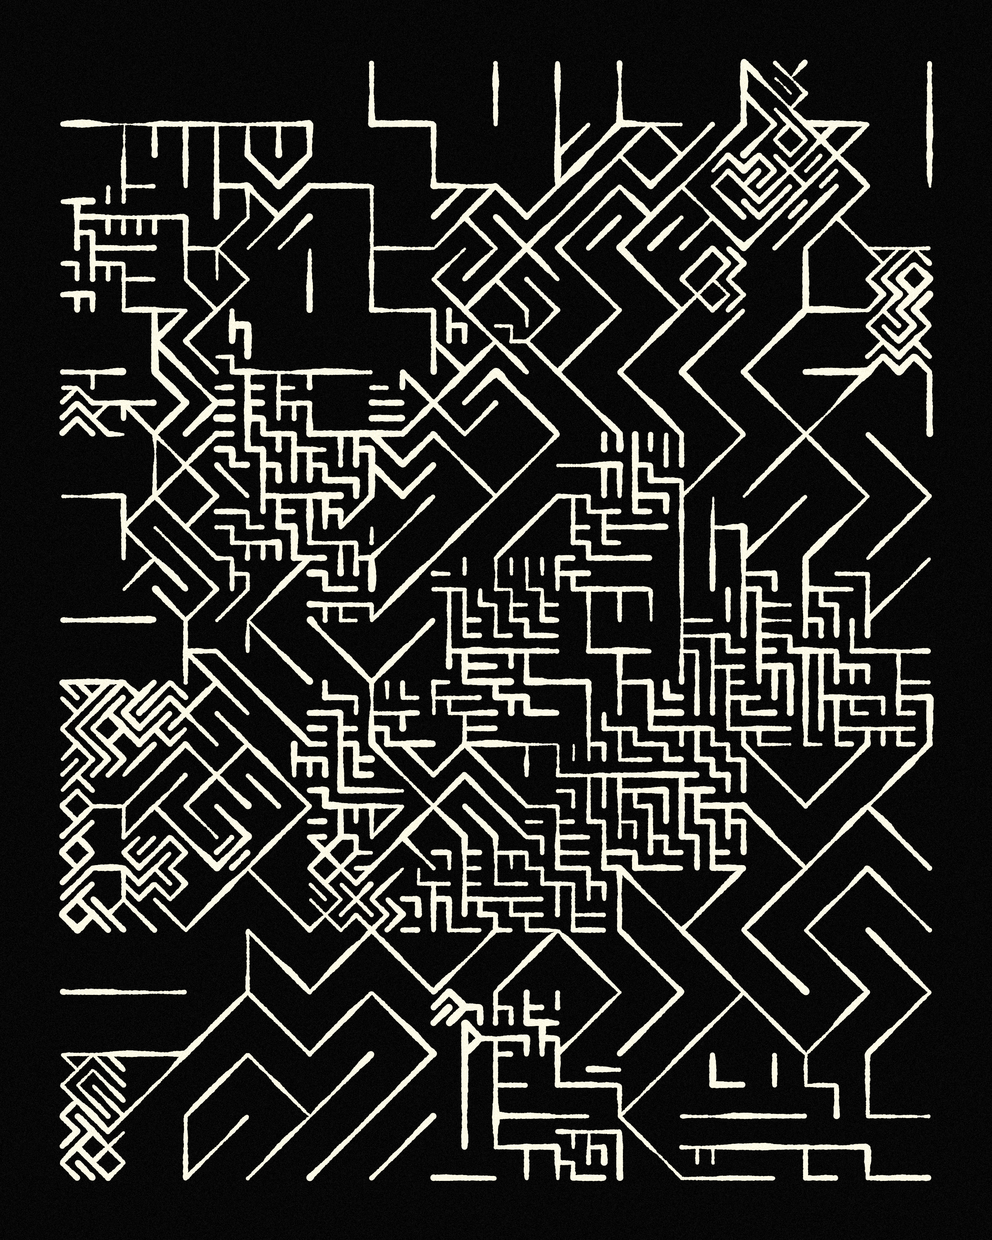
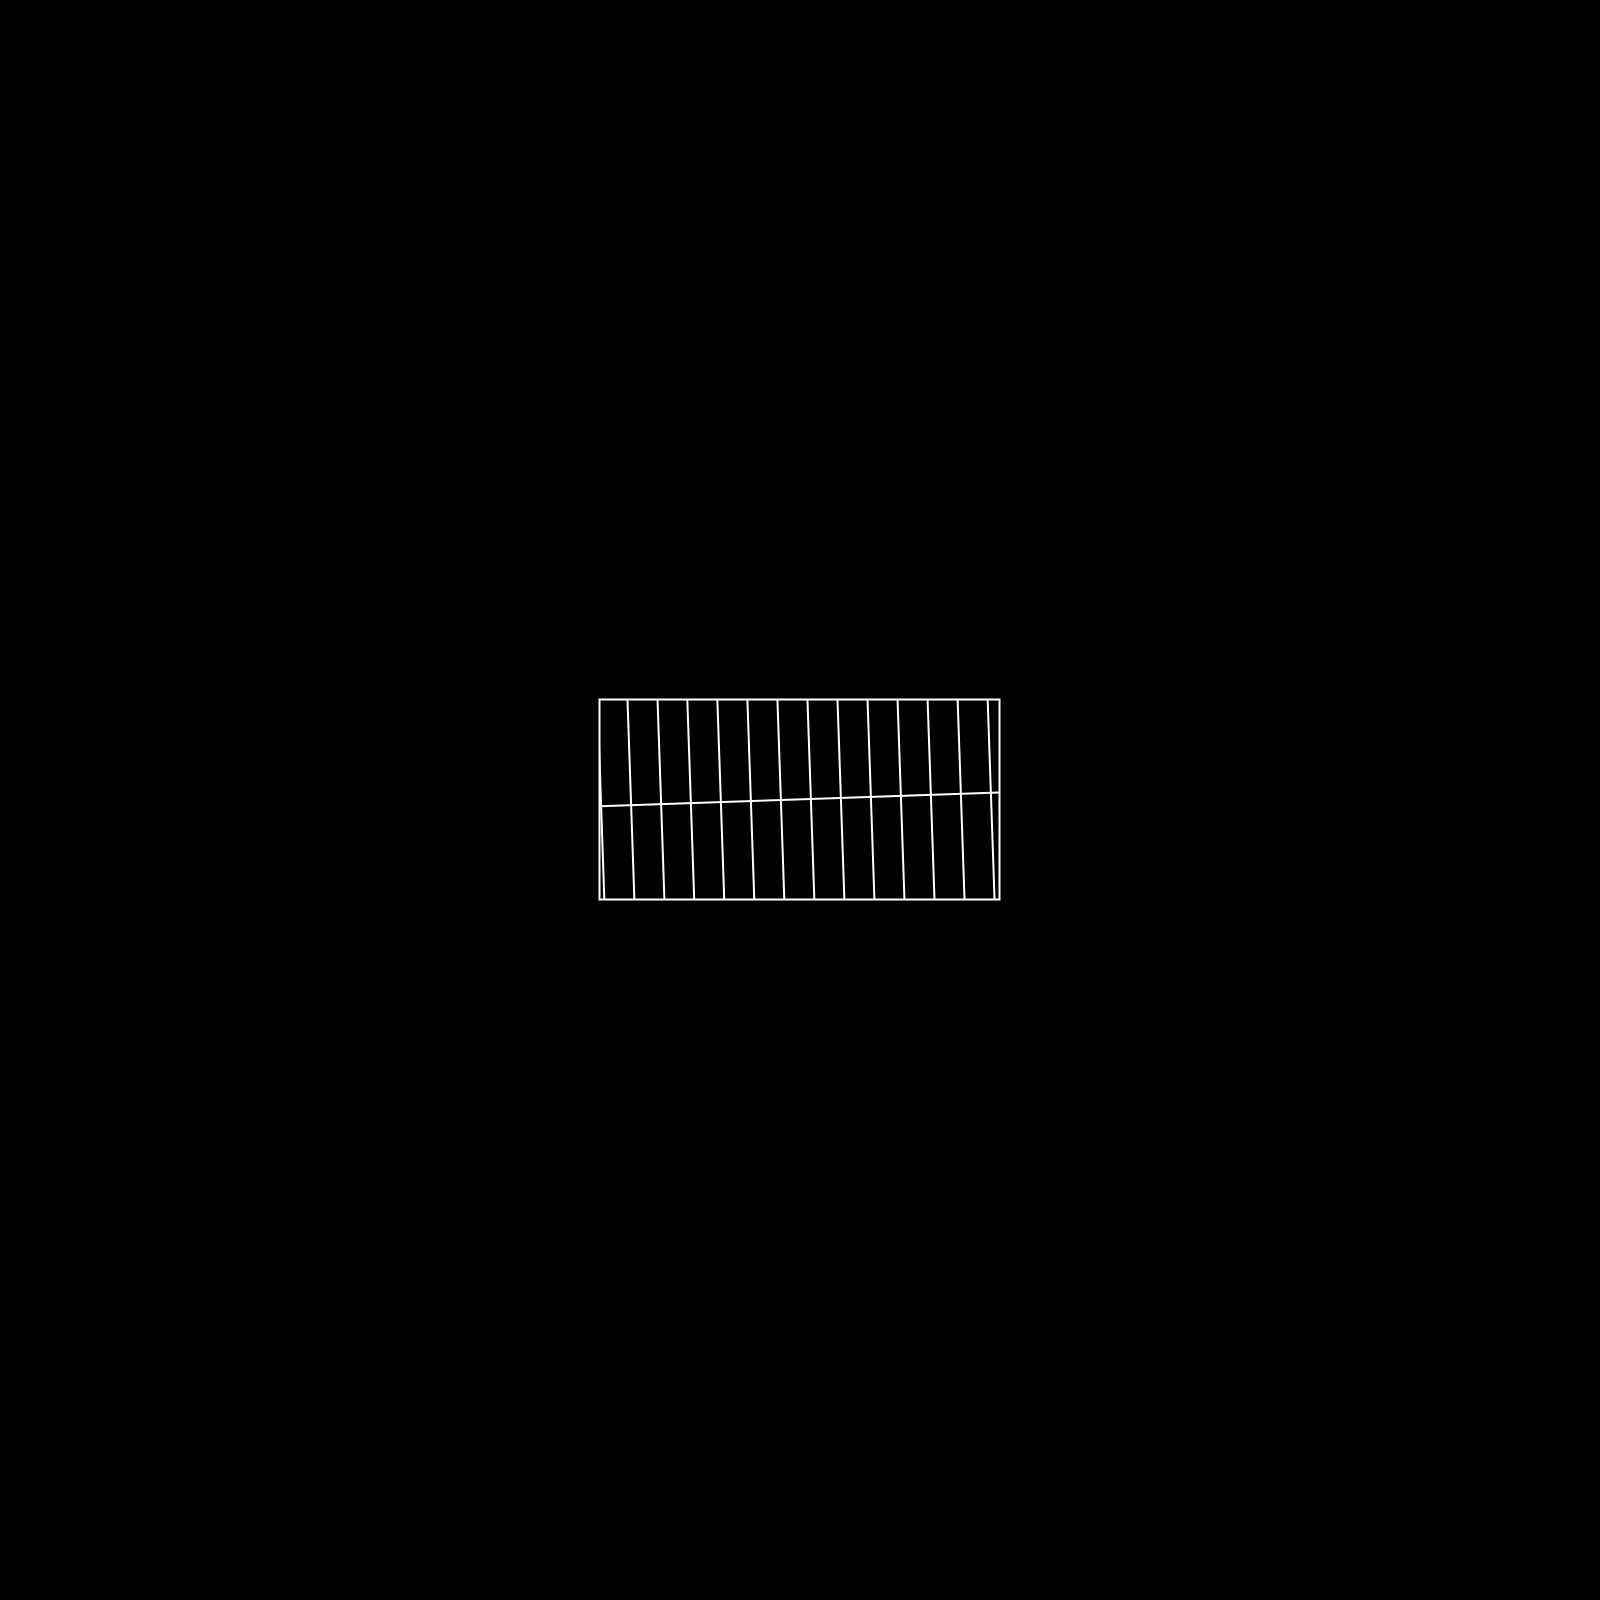
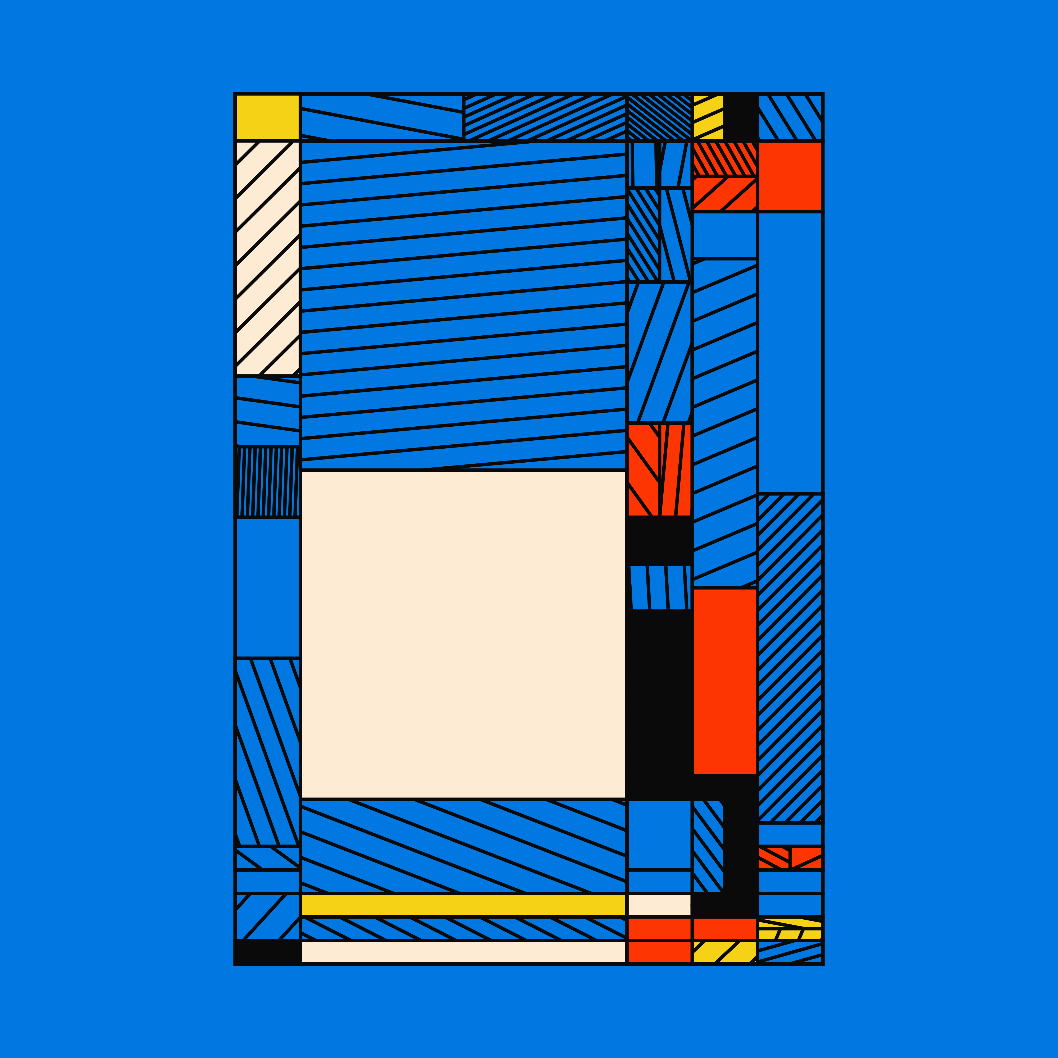
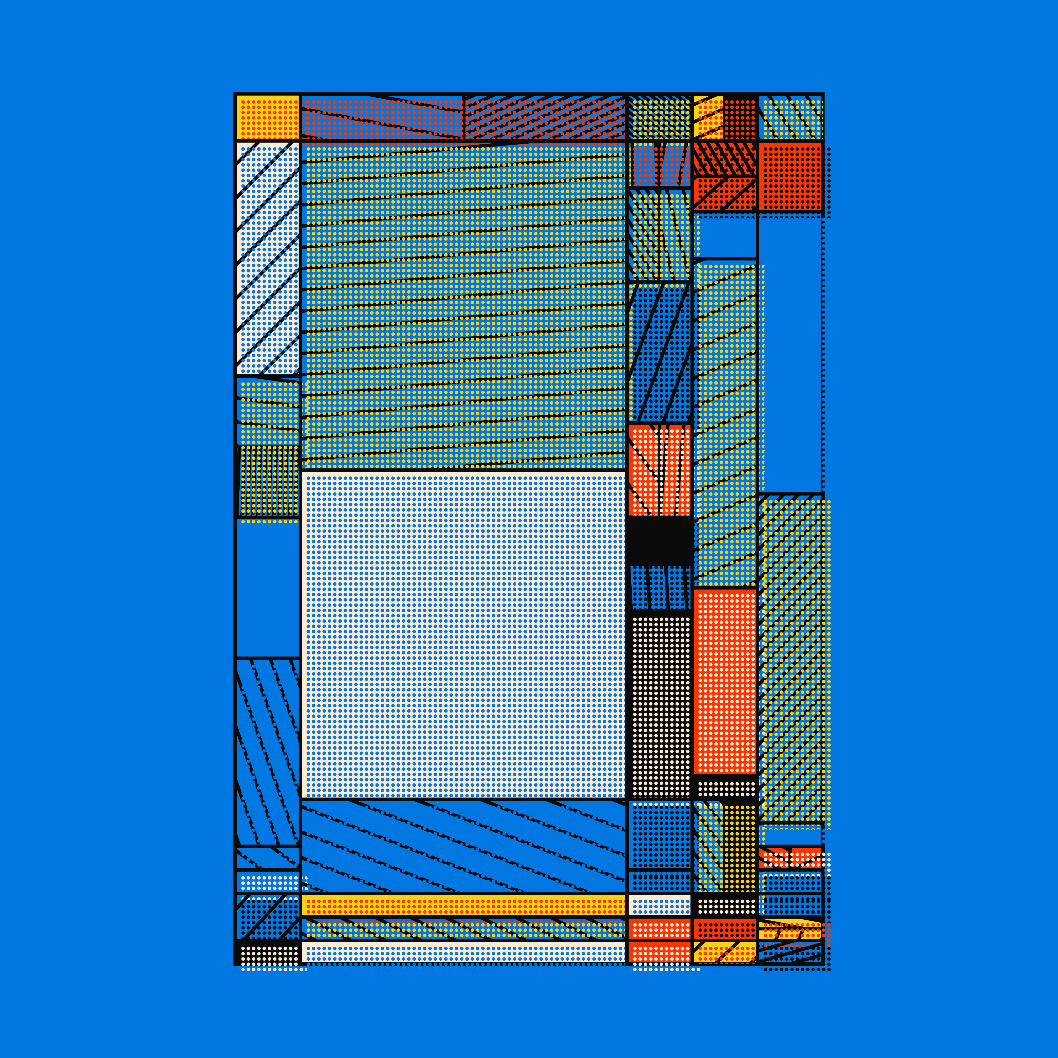
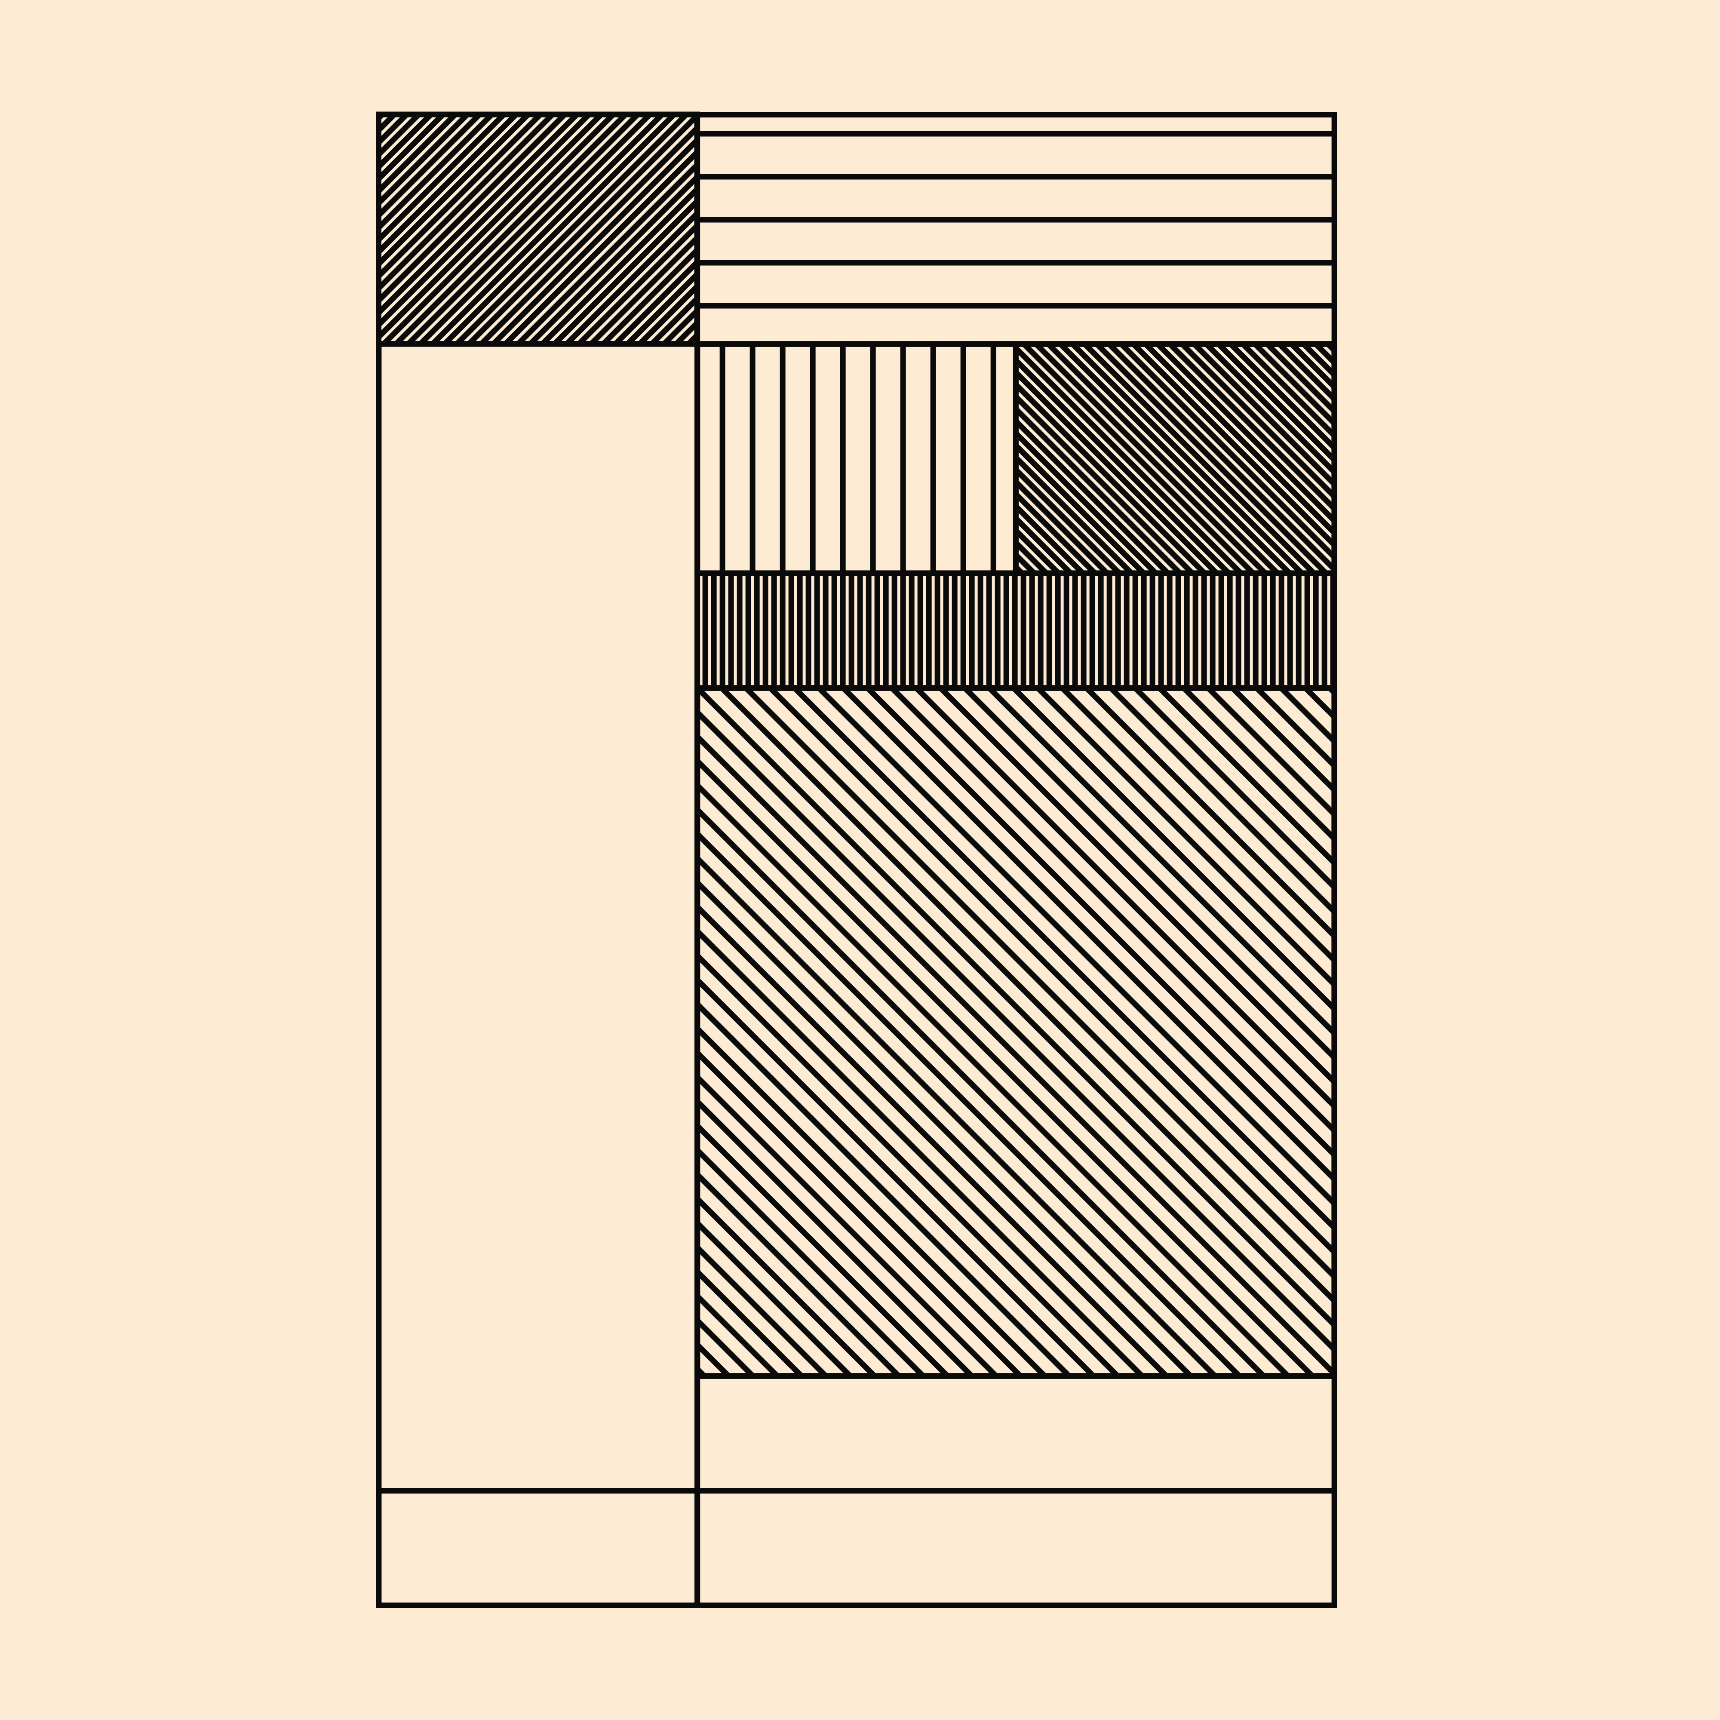
Adding this into the code we end up with a grid that looks as follows:
Parameters and Stylistic Choices
Choosing what aspects of the sketch were controlled by the parameters was a bit tricky, but I think I found a good balance at the end.
One slider was dedicated for the angle of the hachure lines, as these had a significant visual impact on the overall composition:


I also figured that the grids of dots overlaid on the rectangles might not be everyone's jam and hence on of the toggles controlled the amount of these overlays that occur throughout the iteration:
These dots were an idea that I learned from a tweet by Matt DesLauriers, where it makes it seem like there's more than 5 colors even though it is just a dithered optical illusion:
Dithering with two primary colours sometimes creates the expected 'mixed' optical/perceived colour, like RED+BLUE=PURPLE and RED+YELLOW=ORANGE. But mixes like BLUE+YELLOW I perceive as gray.
— Matt DesLauriers (@mattdesl) March 14, 2023
Is there a name for this phenomena? And ways to calculate/simulate the optical mixing? pic.twitter.com/vrMFAJJhJh
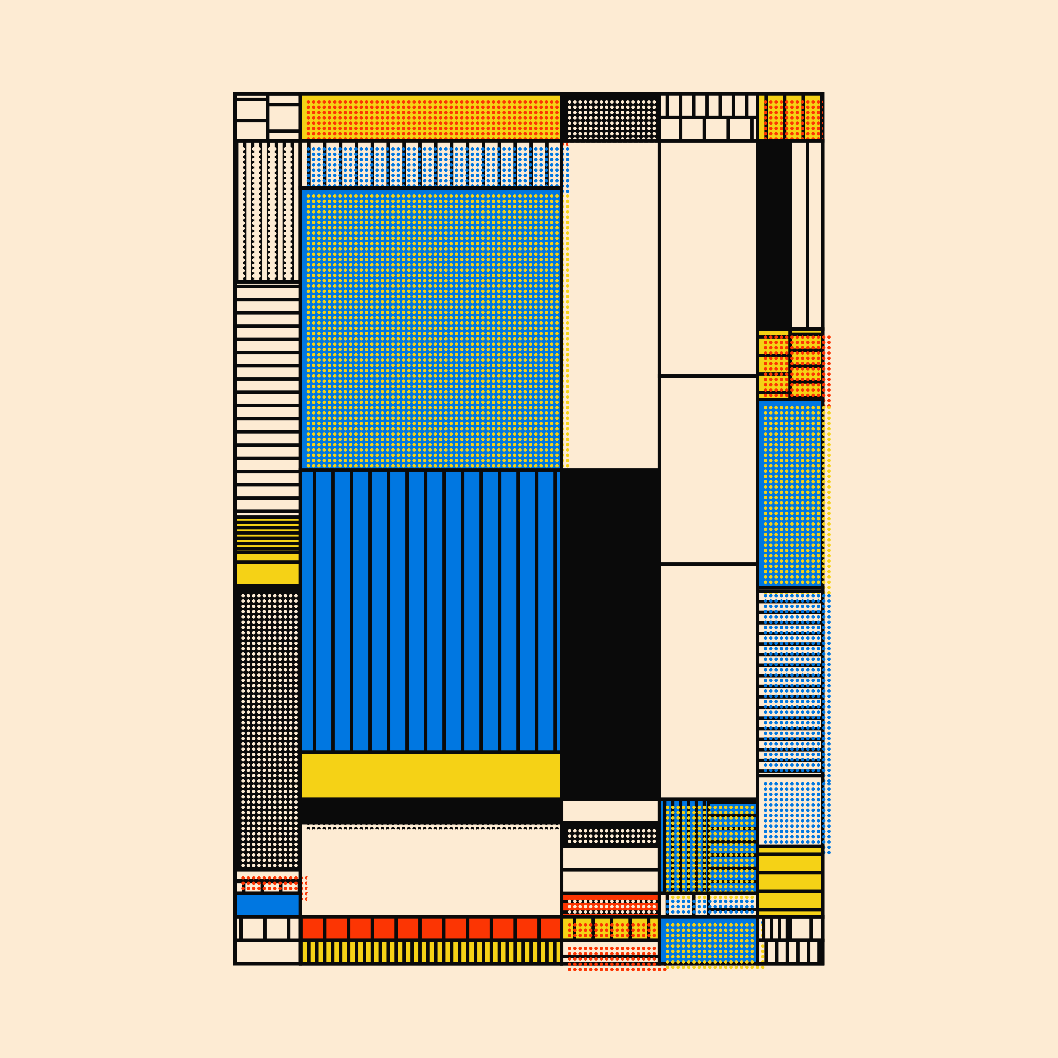
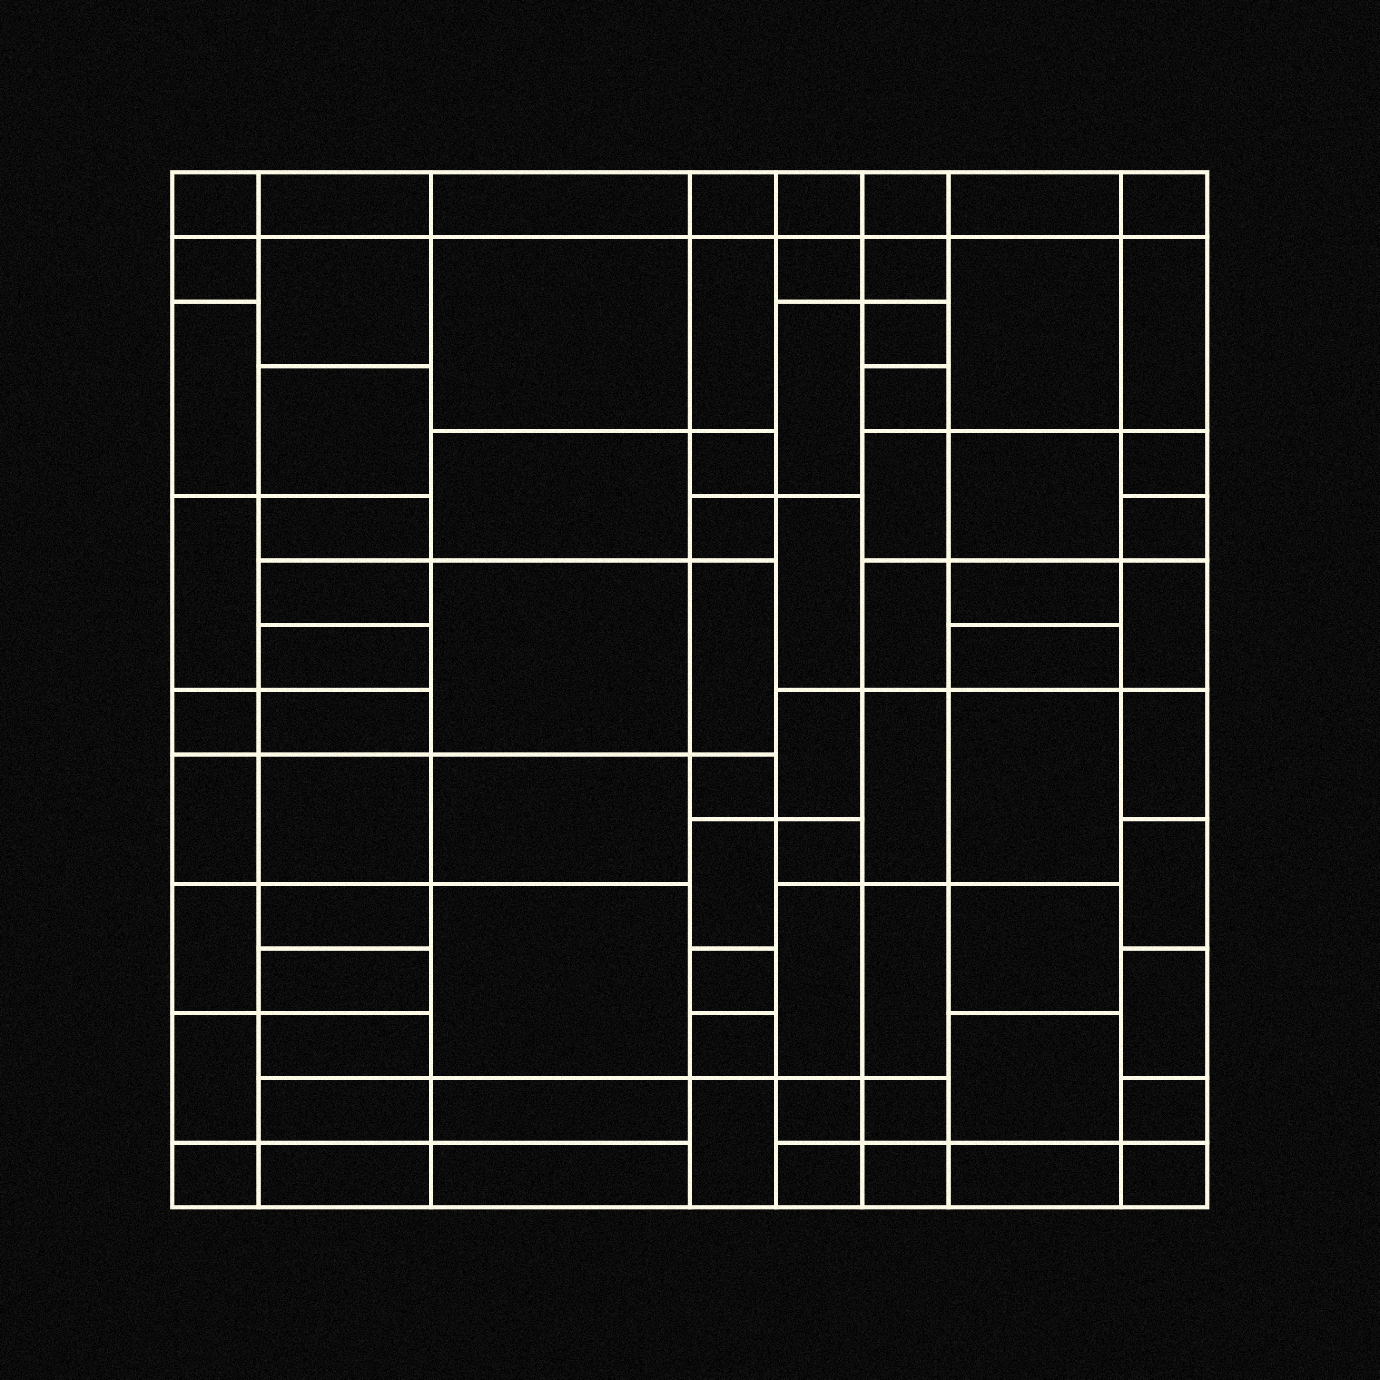
Another slider controls the number of vertical and horizontal subdivisions of the grid, and subsequently controls how visually complex the overall pattern is:
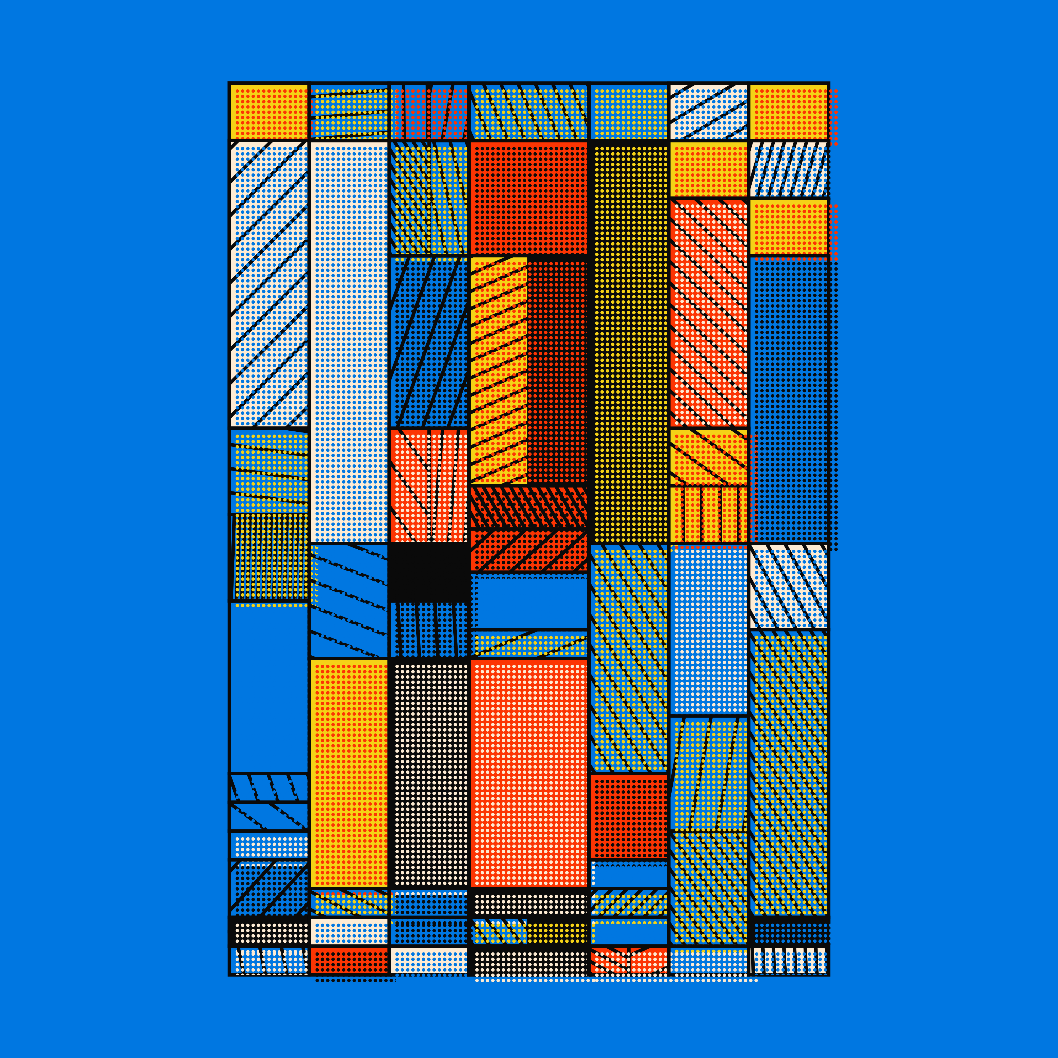
I'm always surprised that collectors are more drawn towards the simpler ones, rather than the more cluttered outputs that I personally prefer.
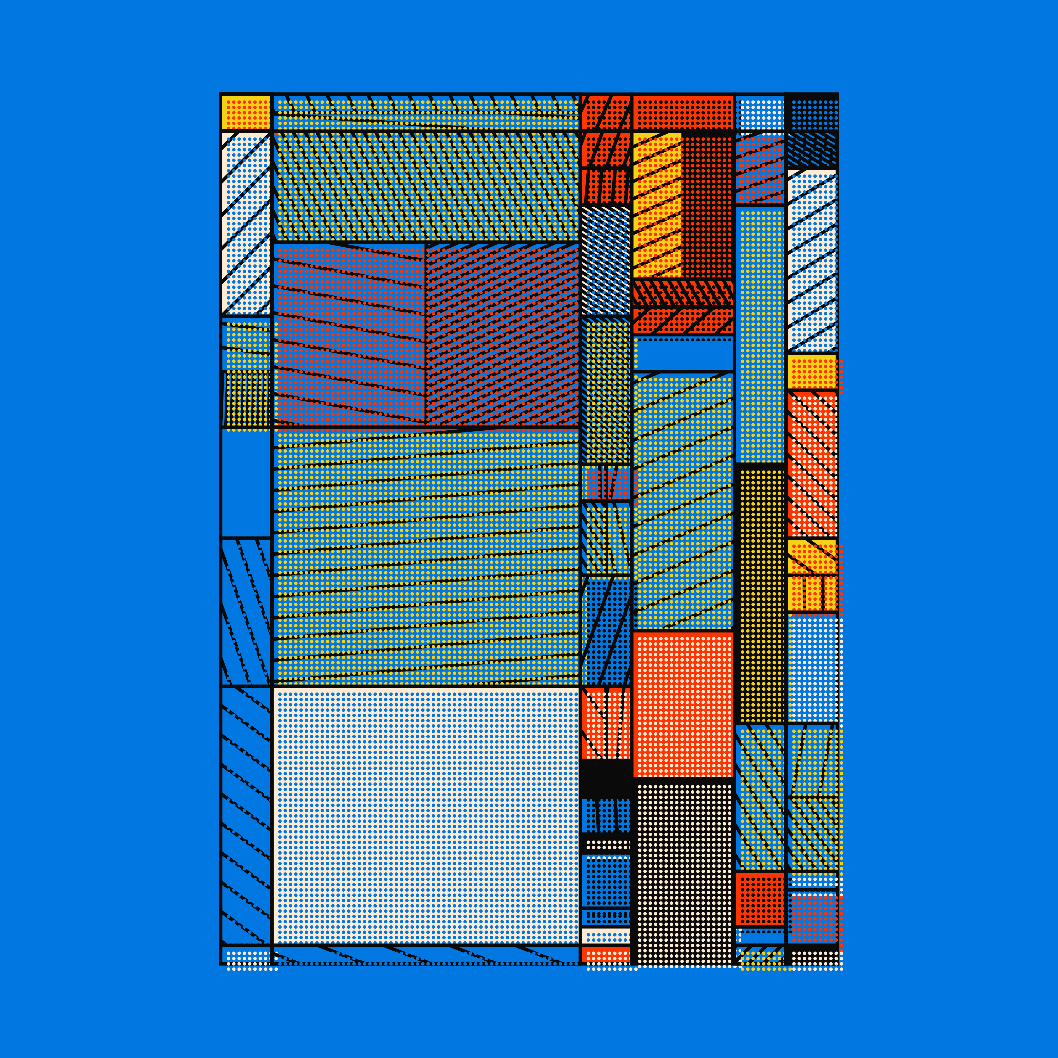
Then there's another slider that controls the random seed as well as the position of the block on the canvas, which is kind of just a slider that I added for fun, as I found that offsetting the grid creates an interesting negative space patch on the canvas.
What I thought was also important, is the order of the sliders. For instance, the random seed should definitely sit at the top, as it modifies the entire sketch and would undo the effect of the other sliders. With the minimal interface it would be difficult to find those again.
Release and Concluding Thoughts
If you made it this far, thank you for reading! And if you're one of the collectors, then thanks a million for collecting, co-creating, and bringing Blöck to life on the Tezos blockchain. All the positive feedback I got from folks on different platforms is incredibly encouraging, and brings back a lot of the creative joy that I found in the early days of my generative art journey.
All iterations of Blöck sold out in less than 12 hours, and collectors overall really enjoyed playing with the parameters. I think the simple interface of editART is really nice, and a bit reminiscent of the esoteric and minimal interface of early HEN that many people fell in love with.
Here are some things Twitter friends have said about the token:
Blöck #82 by @gorillasu
— 𝔪𝔢𝔢𝔷 🌴 (@meezwhite) April 10, 2023
It seemed almost impossible to commit to a Blöck piece given all the amazing variations to choose from.
After trying out 1001 random seeds for a specific configuration I liked, I minted my first co-created piece on @editart_xyz#generativeart #editart pic.twitter.com/IXE3ivfLzJ
The last collection of @gorillasu on @editart_xyz is a majestic equilibrium Between textures and computer windows. pic.twitter.com/Sme29rpVkz
— Eggs of Unknow Fox ☮️ (@EggsUnknow) April 10, 2023
Back co-creating on @editart_xyz.
— João Pescada (@jpscd) April 10, 2023
This time, textured, off centre and on purpose. Refreshingly simple and pleasant. 😊
🖼️ Blöck #92 by @gorillasu pic.twitter.com/E0d6Hczode
Minting Blöck by @gorillasu over on @editart_xyz. At 3tz and so easy to play around with, it made me smile. Nice work, Ahmad! :) https://t.co/3mxii13m3e
— Marius Watz (@mariuswatz) April 9, 2023
very nice, params saved. can't wait to mint this beauty! pic.twitter.com/kKGizMHXWu
— ktorn (@ktorn) April 8, 2023
Blöck #80 and #98 - @gorillasu
— lonemallard.tez (@crypto_mallard) April 10, 2023
Nice work! The co-creation aspect is a lot of fun and I love the minimalist implementation on @editart_xyz. pic.twitter.com/VBrSVbqyK4
And that's a wrap! Big big thanks to pifragile for putting together the platform and helping out a lot along the way to get the token published! Go show him some love on social media and check out the platform!
Blöck sold out quickly on @editart_xyz
— Piero (pifragile) (@pifragile) April 10, 2023
Congrats to @gorillasu for the wonderful piece and many thanks to all collectors. Happy to welcome 28 new co-creators to the platform :)#editart pic.twitter.com/aDCsi4eQTz
Thanks for reading, and happy creative coding! Cheers!
If you want to read more, check out this article I wrote about FxParams:
Otherwise, if you want to support my writing and work consider sharing a link to this post on your social media or with friends and family. Sharing links to the blog helps out a bunch, it essentially tells search engines that there's good content on my blog.
I also have a piece up on FxHash that's still minting if you'd like to collect another token: